Fig. 2
Download original image
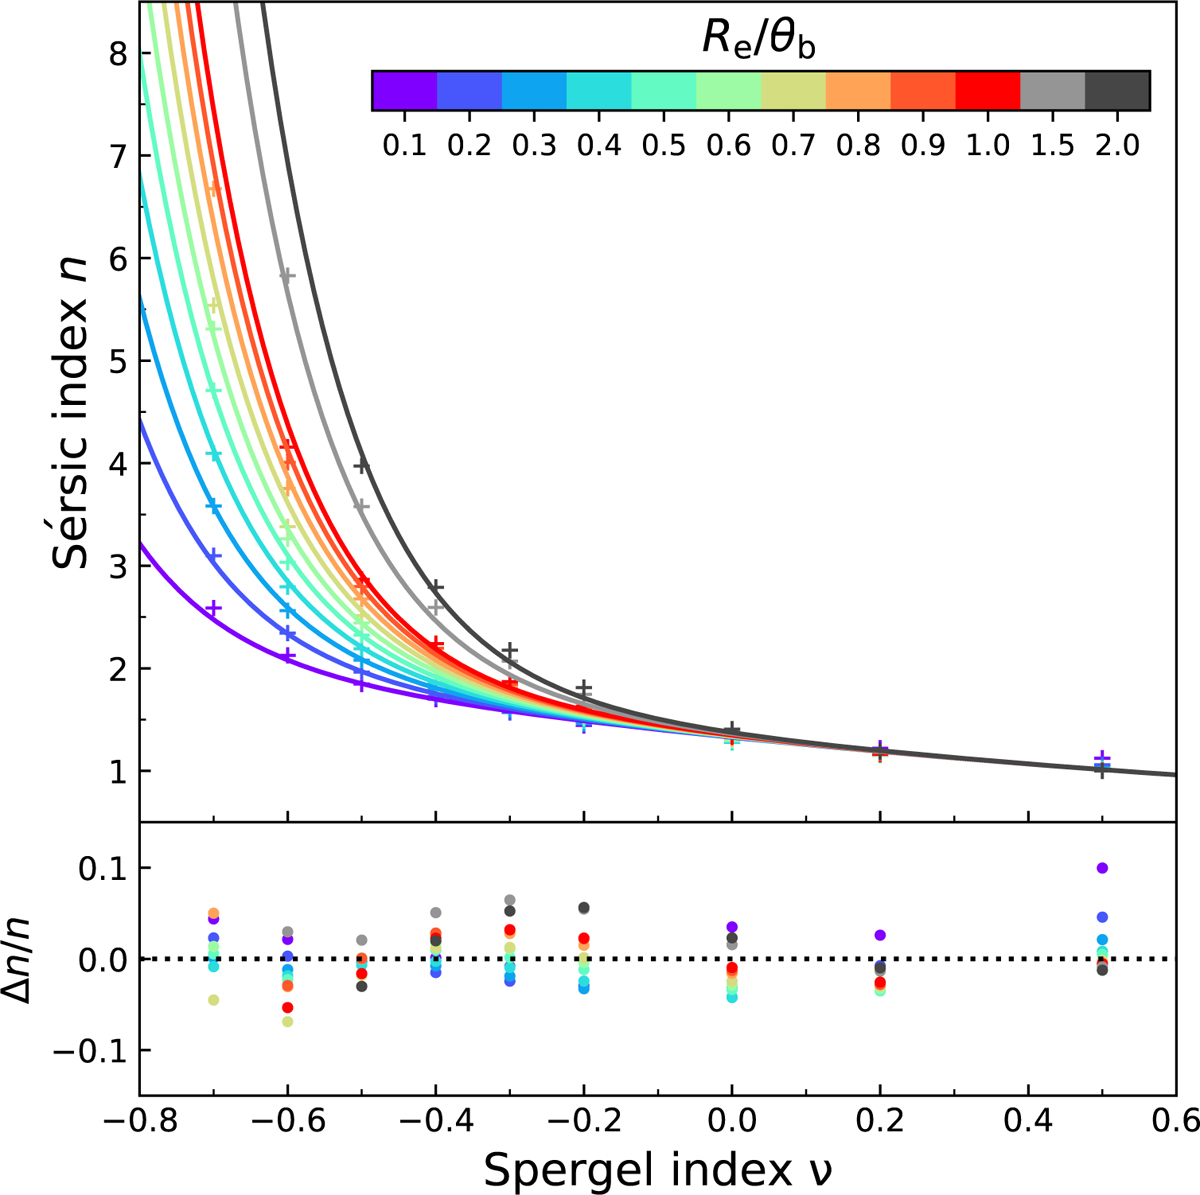
Comparison of Sérsic and Spergel indices. The data (crosses) in the top panel represent the galfit Sérsic indices measured for sources created with the input Spergel model for a range of v values from −0.7 to 0.5 and for different source effective radii (expressed in terms of the FWHM of the synthesized beam, Re/θb) ranging from 0.1 to 2.0. The solid curves in the top panel denote the best-fit empirical relation between Spergel v and galfit Sérsic n, depending on Re/θb, as expressed by Eq. (3). The lower panel displays normalized residuals to the proposed relation.
Current usage metrics show cumulative count of Article Views (full-text article views including HTML views, PDF and ePub downloads, according to the available data) and Abstracts Views on Vision4Press platform.
Data correspond to usage on the plateform after 2015. The current usage metrics is available 48-96 hours after online publication and is updated daily on week days.
Initial download of the metrics may take a while.