Fig. A.1
Download original image
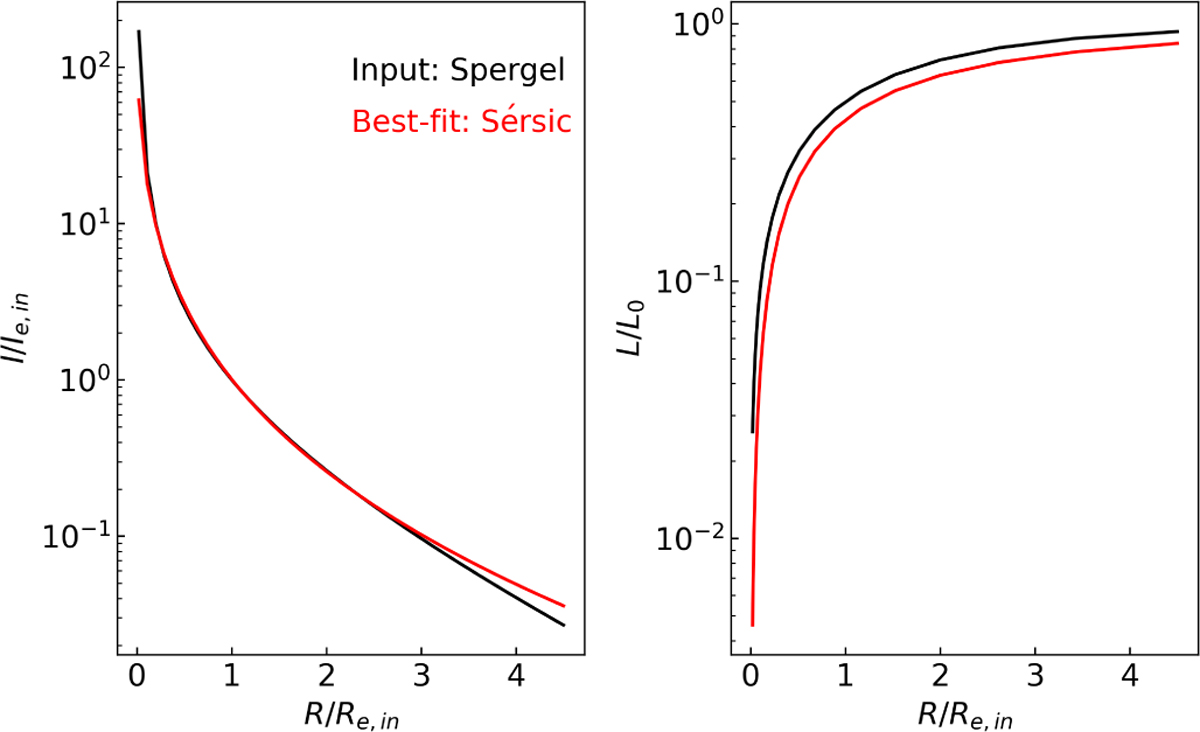
Comparison of the Sérsic profile with the Spergel profile using mathematical simulations. Left: Surface density profiles for Spergel function (black) compared to the best fit with a Sérsic function (red) through mathematical simulations. Right: Comparison of the integrated surface density profiles for the Sérsic and Spergel functions shown in the left panel. The values of Re,in and Ie,in are held fixed and represent the input parameters in the Spergel profile.
Current usage metrics show cumulative count of Article Views (full-text article views including HTML views, PDF and ePub downloads, according to the available data) and Abstracts Views on Vision4Press platform.
Data correspond to usage on the plateform after 2015. The current usage metrics is available 48-96 hours after online publication and is updated daily on week days.
Initial download of the metrics may take a while.