Fig. 13
Download original image
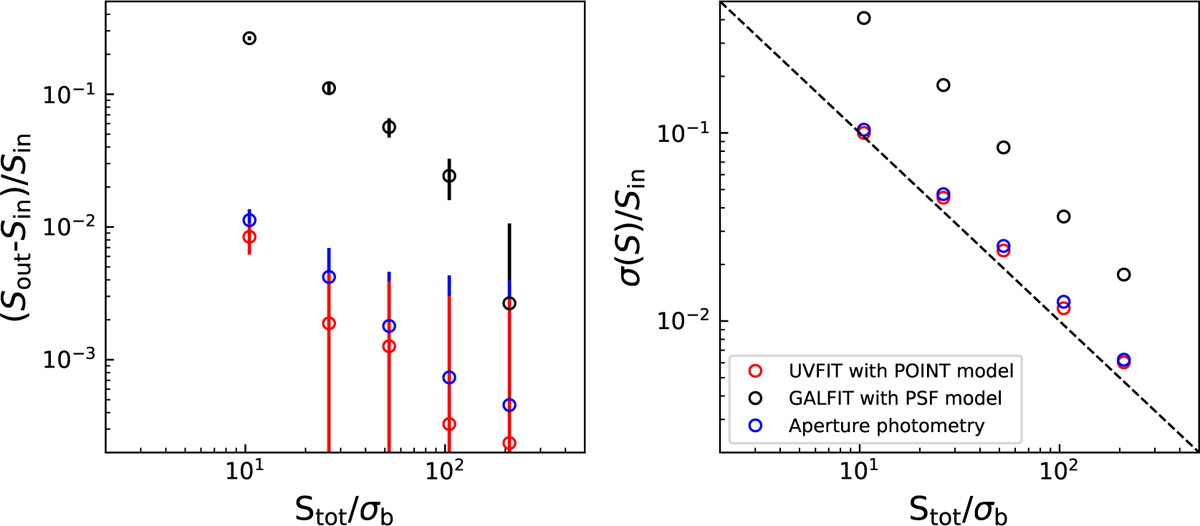
Simulation results of the flux density bias (left) and relative uncertainty of measurement on the recovery of flux density (right) for point sources using uv_fit (red), galfit (black), and aperture photometry (blue) in the image-plane fitting, as a function of the flux S/N. The error bars in the left panel represent the standard error on the mean. The dashed line in the right panel is a 1:−1 line.
Current usage metrics show cumulative count of Article Views (full-text article views including HTML views, PDF and ePub downloads, according to the available data) and Abstracts Views on Vision4Press platform.
Data correspond to usage on the plateform after 2015. The current usage metrics is available 48-96 hours after online publication and is updated daily on week days.
Initial download of the metrics may take a while.