Fig. 11
Download original image
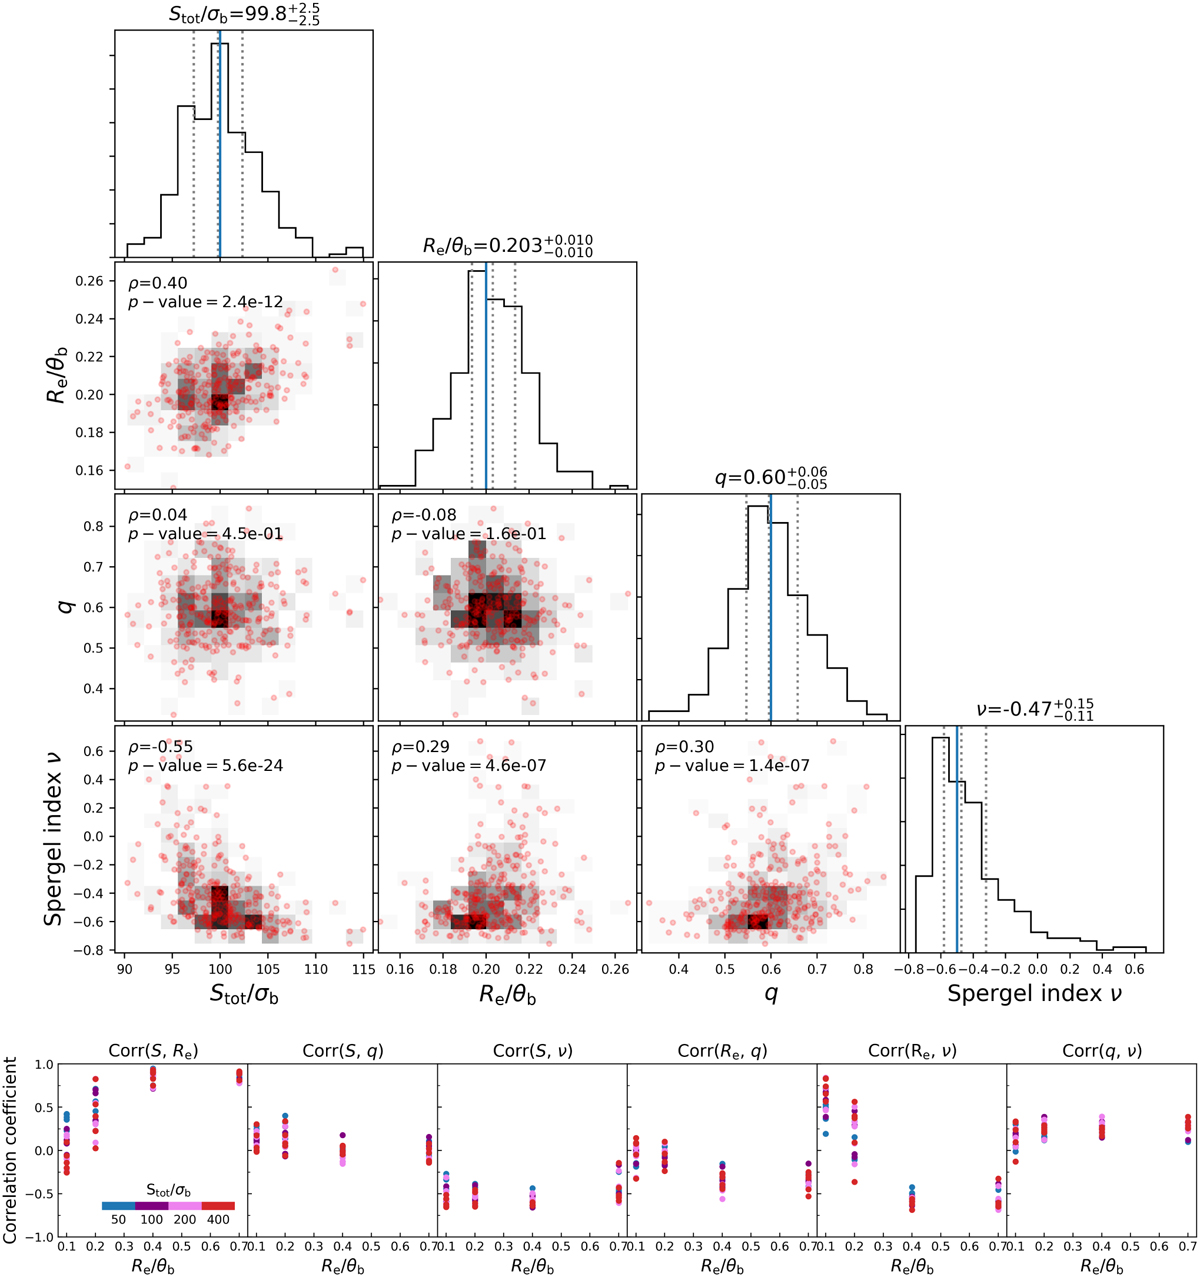
Correlations between the fitted parameters obtained from Spergel profile fitting in the uυ-plane. Top: corner plots showing the covariances between the free parameters modeled in the Spergel profile fitting. The example model source has a flux density of Stot/σb = 100, a size of Re/θb = 0.2, an axis ratio of q=0.6, and a Spergel index of v = −0.5. The shaded density histograms show the two-parameter distributions with the Spearman rank correlation coefficient and p-value marked in each panel. The one-dimensional histograms at the top of each column represent the individual parameter distributions, annotated with the median values. The boundaries of the 25th and 75th percentiles of the distribution are plotted as dashed lines, while the blue vertical lines show the true values. Bottom: Spearman’s rank correlation coefficients of the two-parameter pairs as a function of source size. The points are color coded by the input flux density.
Current usage metrics show cumulative count of Article Views (full-text article views including HTML views, PDF and ePub downloads, according to the available data) and Abstracts Views on Vision4Press platform.
Data correspond to usage on the plateform after 2015. The current usage metrics is available 48-96 hours after online publication and is updated daily on week days.
Initial download of the metrics may take a while.