Fig. 9
Download original image
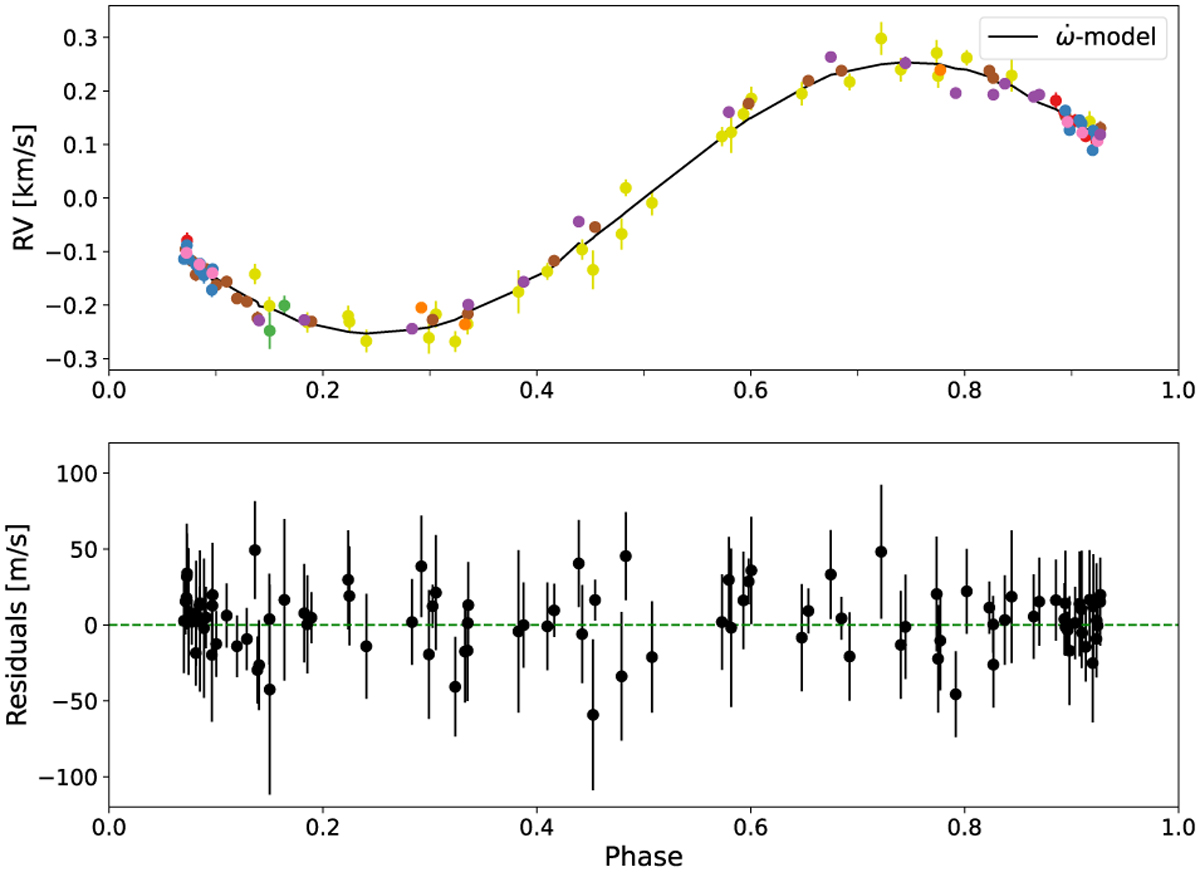
Data with errorbars, phase-folded with our fit including periastron precession, shown in the upper plot. The colours represent different datasets, as in Fig. 1 (see also Sect. 4.2 for more details). Residuals of the periastron precession rate fit are shown in the lower plot. The error-bars include the jitters, as in Table 4. In both plots, the in-transit points are not shown as they were not used in the fit.
Current usage metrics show cumulative count of Article Views (full-text article views including HTML views, PDF and ePub downloads, according to the available data) and Abstracts Views on Vision4Press platform.
Data correspond to usage on the plateform after 2015. The current usage metrics is available 48-96 hours after online publication and is updated daily on week days.
Initial download of the metrics may take a while.