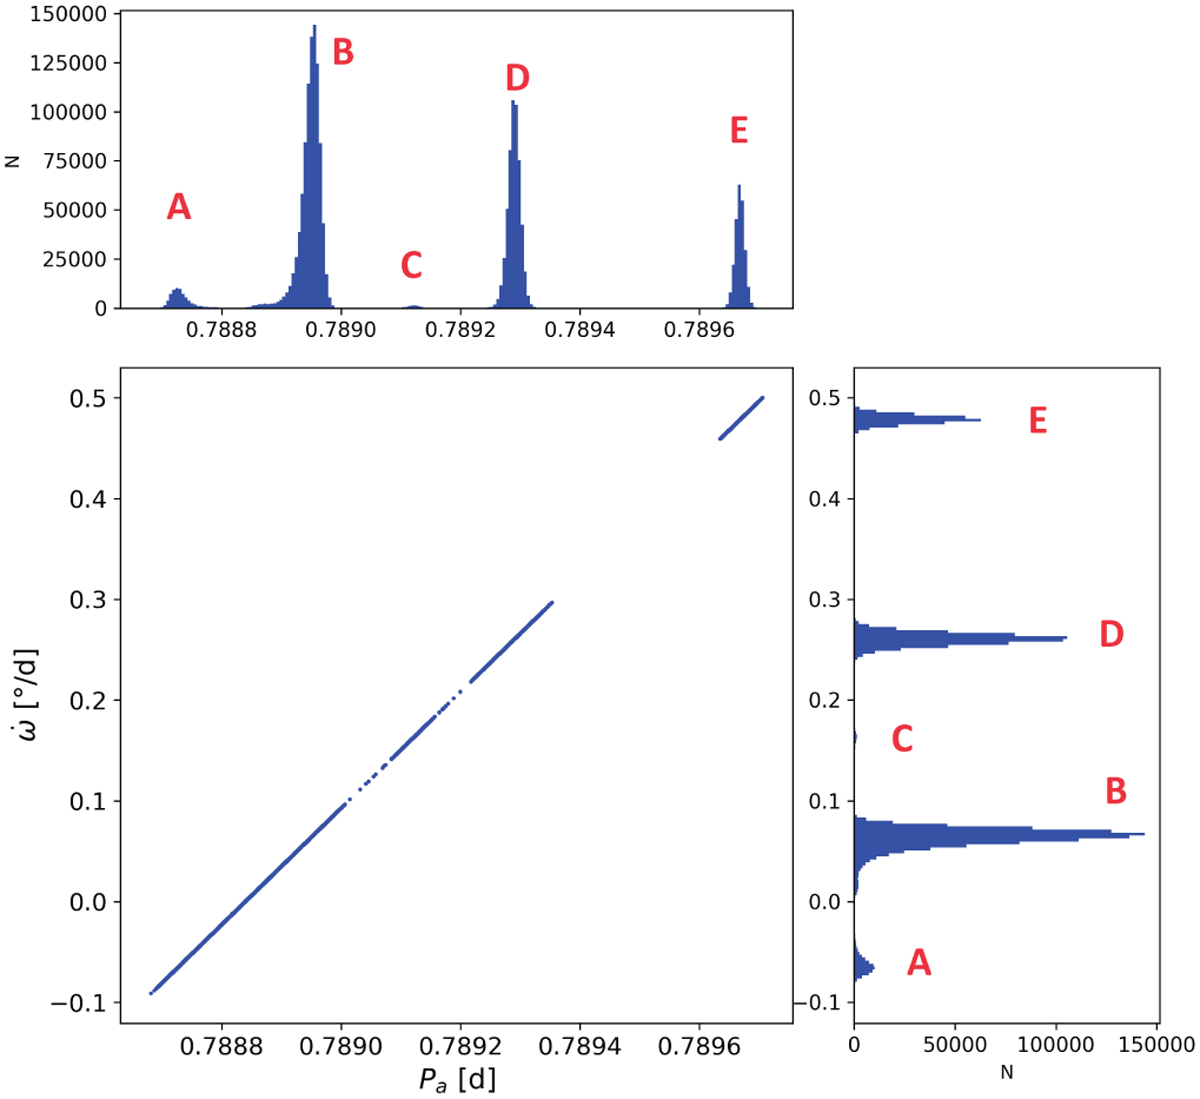
Fig. 6
Download original image
Posterior distributions and correlation between the anomalistic period and periastron precession rate where the chains converged. The middle plot shows the strong correlation between these two free parameters, as in Eq. (12). On the sides, are the corresponding histograms of the posterior distributions. As can be seen from the histograms on the sides, many chains converged to various positive and negative peaks, as predicted by the semi-grid method and reported in Table 5.
Current usage metrics show cumulative count of Article Views (full-text article views including HTML views, PDF and ePub downloads, according to the available data) and Abstracts Views on Vision4Press platform.
Data correspond to usage on the plateform after 2015. The current usage metrics is available 48-96 hours after online publication and is updated daily on week days.
Initial download of the metrics may take a while.