Fig. 5
Download original image
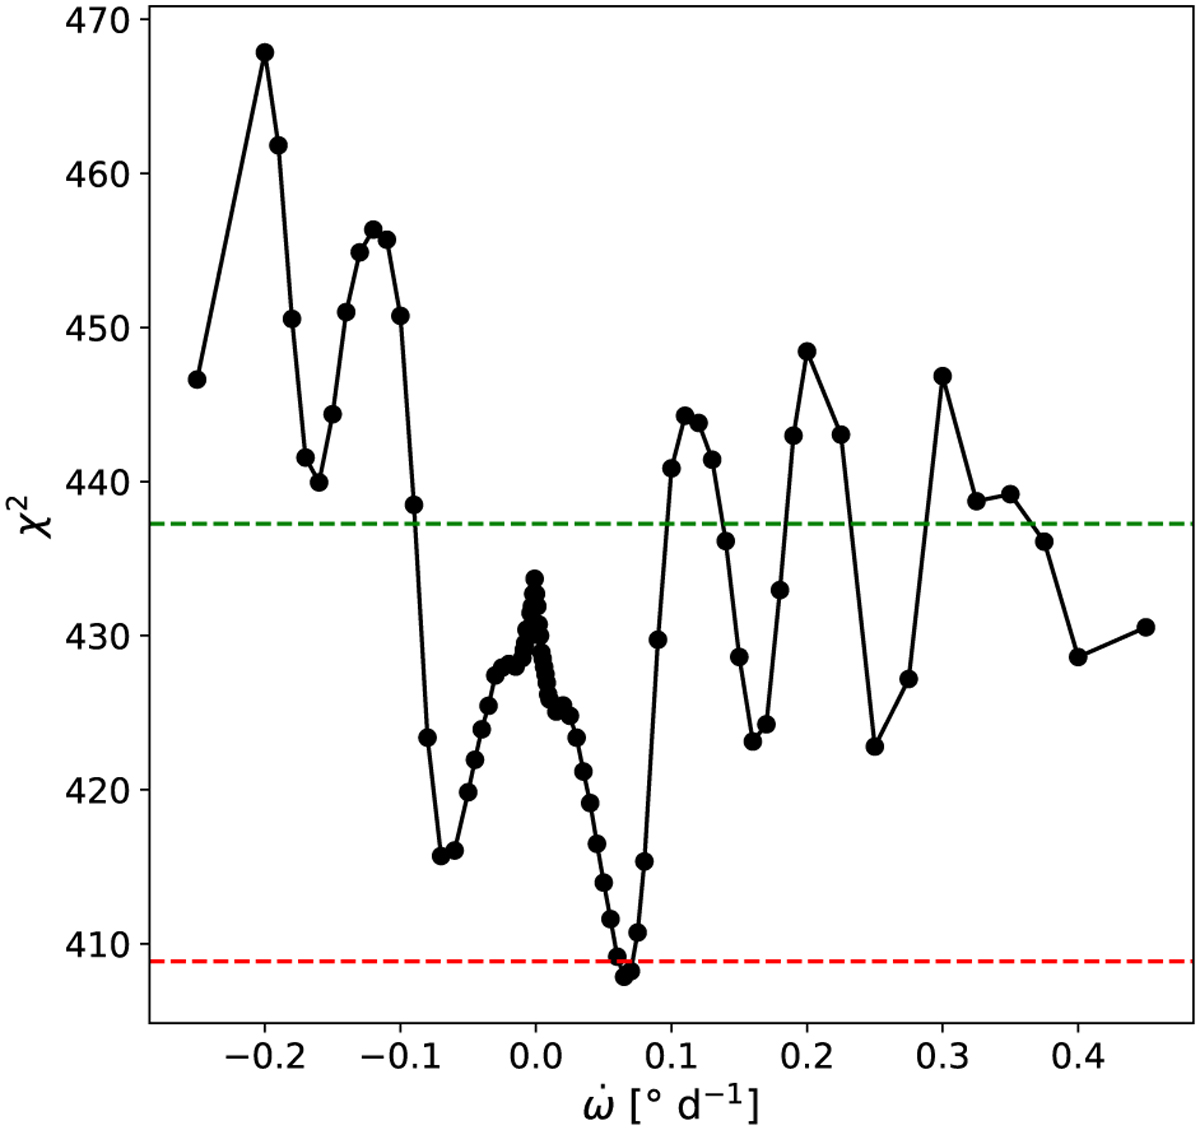
χ2 values of the fit when varying ![]() in the model. The horizontal dashed line separates the statistically worse models (over the line) from the best models (below the dashed lines). The models below the dashed lines are statistically equivalent within 1σ (68% confidence level for the red line) and 2σ (95% confidence level for the green line). Note: the significantly larger χ2 at
in the model. The horizontal dashed line separates the statistically worse models (over the line) from the best models (below the dashed lines). The models below the dashed lines are statistically equivalent within 1σ (68% confidence level for the red line) and 2σ (95% confidence level for the green line). Note: the significantly larger χ2 at ![]() . The high amount of local minima is an indication of the complexity of the problem.
. The high amount of local minima is an indication of the complexity of the problem.
Current usage metrics show cumulative count of Article Views (full-text article views including HTML views, PDF and ePub downloads, according to the available data) and Abstracts Views on Vision4Press platform.
Data correspond to usage on the plateform after 2015. The current usage metrics is available 48-96 hours after online publication and is updated daily on week days.
Initial download of the metrics may take a while.