Fig. 3
Download original image
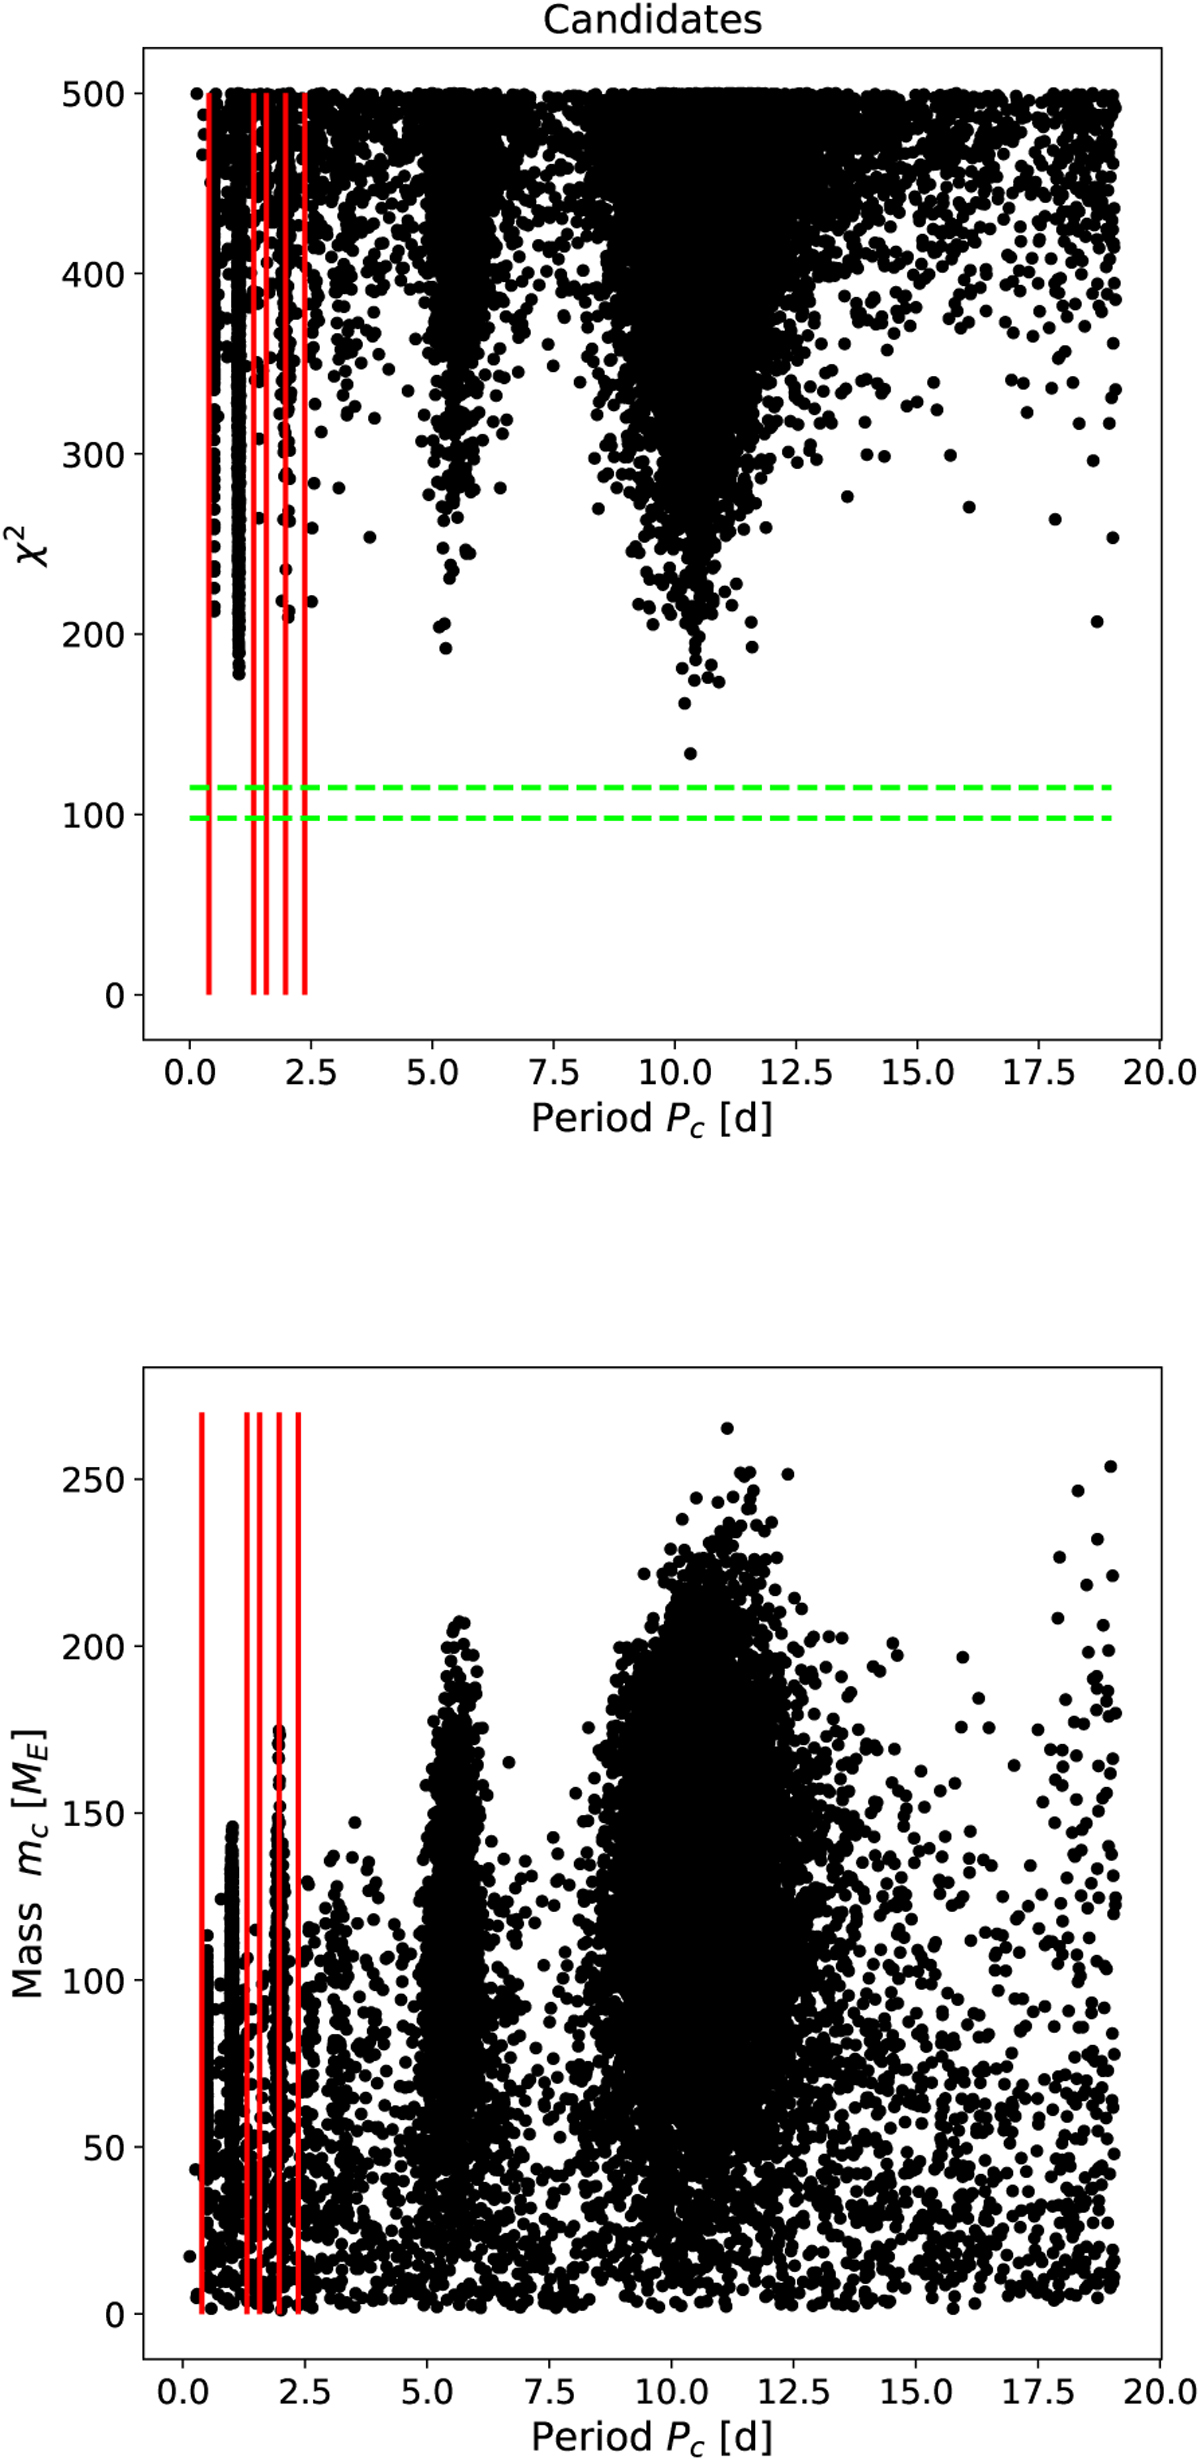
Properties of third bodies excluded by RV data. The plot shows the results for the simulated scenarios including a putative companion planet c of different masses at different periods. Each black dot represents one of the around 20 000 selected scenarios (see the text for more details). Top plot: χ2 value vs the orbital period of the perturber. The red lines correspond to the period of the stable orbits predicted by Cortés-Zuleta et al. (2020). The two horizontal dashed lines represent the χ2 required to have weak (upper line) or strong (lower line) evidence of a second planet, as discussed in the text. Bottom plot: mass and orbital period of the selected candidates.
Current usage metrics show cumulative count of Article Views (full-text article views including HTML views, PDF and ePub downloads, according to the available data) and Abstracts Views on Vision4Press platform.
Data correspond to usage on the plateform after 2015. The current usage metrics is available 48-96 hours after online publication and is updated daily on week days.
Initial download of the metrics may take a while.