Fig. 1
Download original image
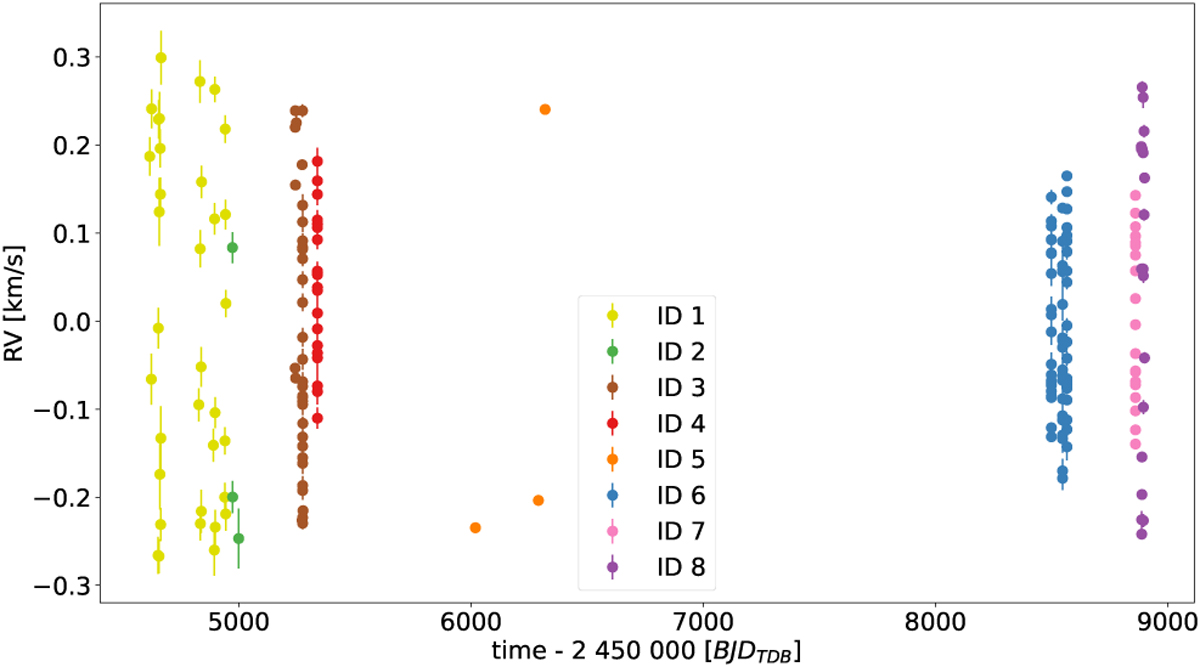
Radial velocity observations of WASP-19Ab, time vs. radial velocities, with corresponding observational errorbars. The different data sets (see Sect. 4) are represented by different colours. Between the datasets, there are significant offsets between different instruments and studies. They have been removed accordingly to the results in Table 4.
Current usage metrics show cumulative count of Article Views (full-text article views including HTML views, PDF and ePub downloads, according to the available data) and Abstracts Views on Vision4Press platform.
Data correspond to usage on the plateform after 2015. The current usage metrics is available 48-96 hours after online publication and is updated daily on week days.
Initial download of the metrics may take a while.