Fig. 6
Download original image
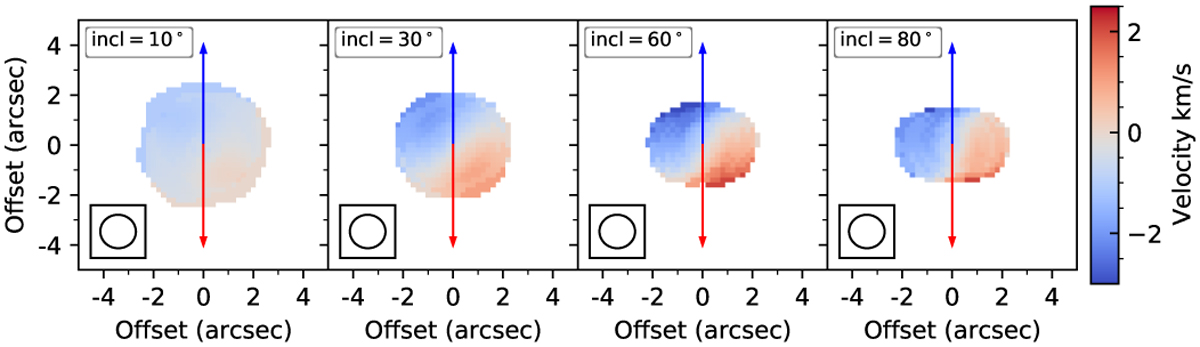
Synthetic SMA observations made with the CASA task “simobserve” from the outputs of radiative transfer calculations of the envelope-disk model shown in Fig. 5. From left to right, the inclination angle of the rotation axis with respect to the line of sight changes from 10° to 80 °. The color scale shows the CH3CN (123−113) first-moment map. The red and blue arrows represent redshifted and blueshifted outflows, respectively. The bottom left of each panel shows the synthesized beam.
Current usage metrics show cumulative count of Article Views (full-text article views including HTML views, PDF and ePub downloads, according to the available data) and Abstracts Views on Vision4Press platform.
Data correspond to usage on the plateform after 2015. The current usage metrics is available 48-96 hours after online publication and is updated daily on week days.
Initial download of the metrics may take a while.