Fig. 4
Download original image
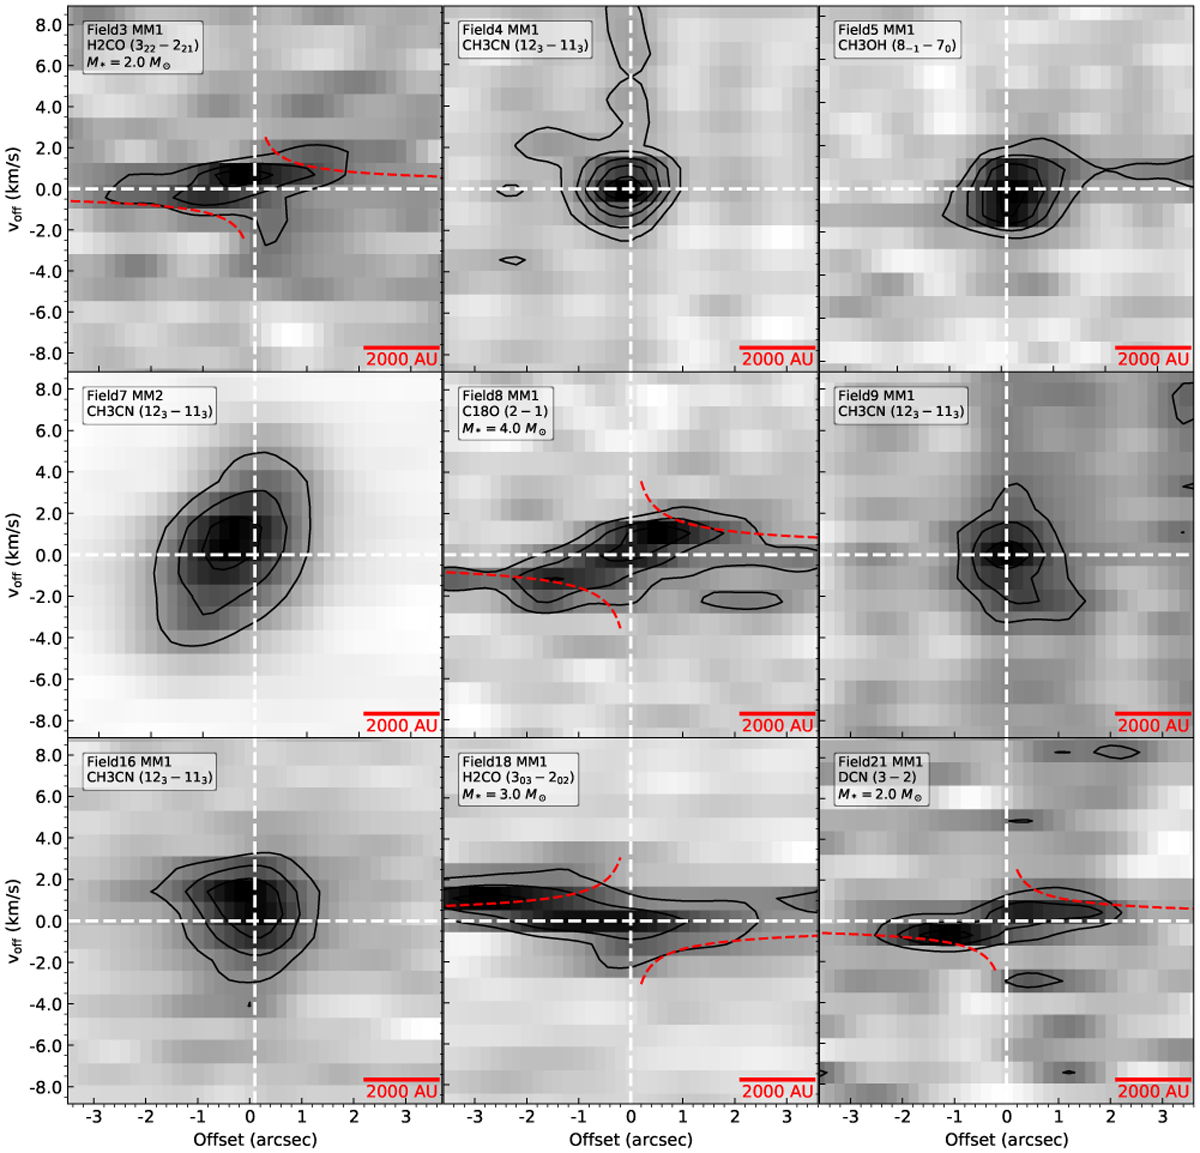
PV diagram of spectral lines toward the disk candidates, cut along the dashed black lines shown in Fig. 3. The dashed red lines show the Keplerian rotation curves for central masses labeled in the upper left. The black contours correspond to 3, 5, 7, 9,11, and 13 σ levels. The vertical line marks the reference point. The horizontal line indicates the systemic velocity.
Current usage metrics show cumulative count of Article Views (full-text article views including HTML views, PDF and ePub downloads, according to the available data) and Abstracts Views on Vision4Press platform.
Data correspond to usage on the plateform after 2015. The current usage metrics is available 48-96 hours after online publication and is updated daily on week days.
Initial download of the metrics may take a while.