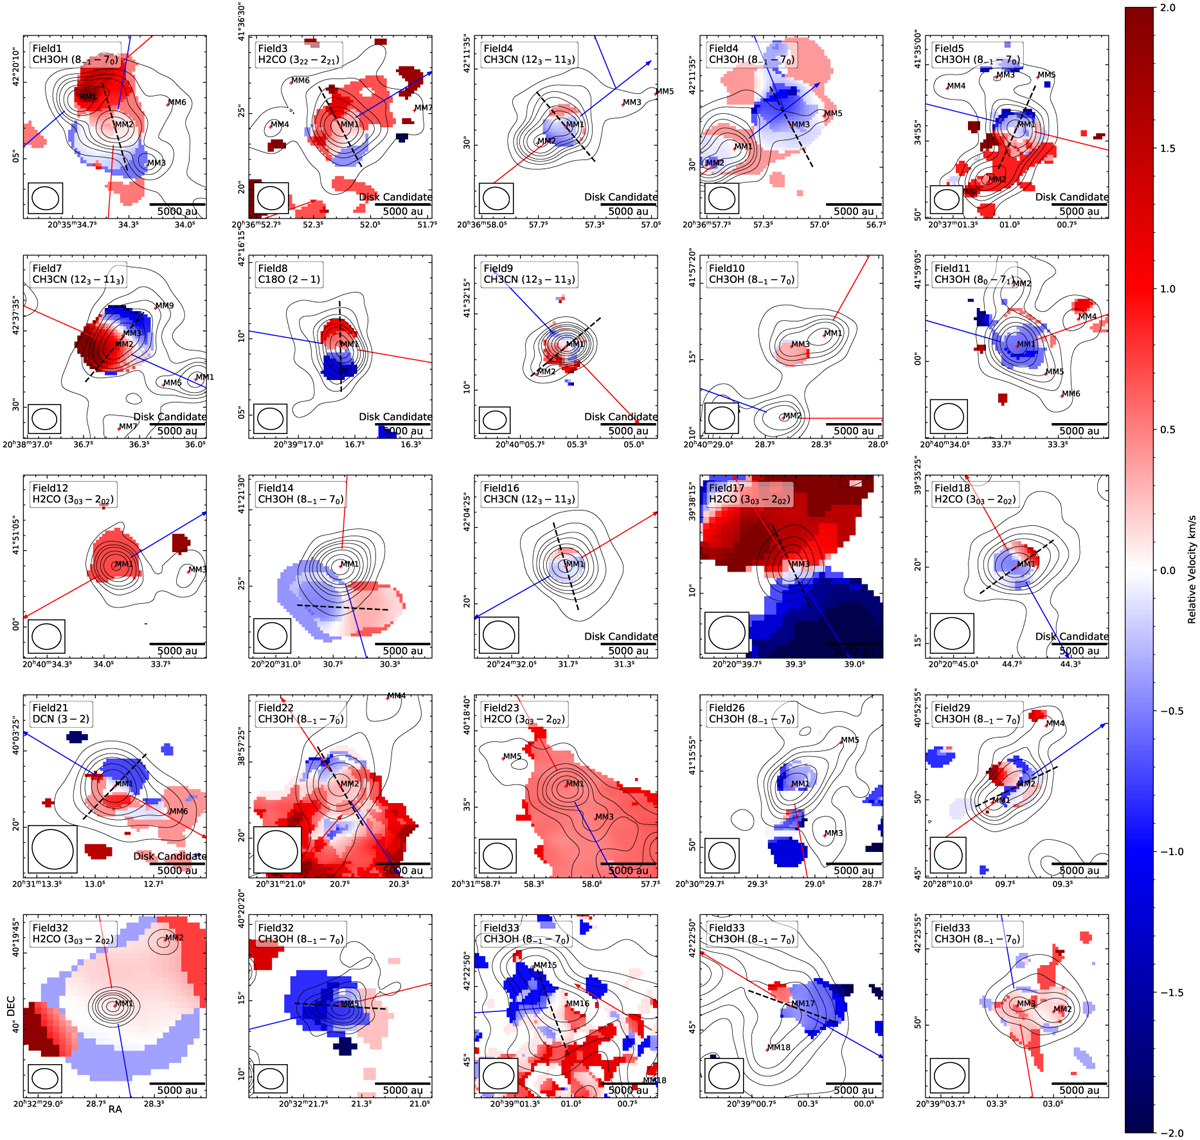
Fig. 3
Download original image
Intensity-weighted mean velocity maps of representative molecular line emission toward all dense-gas-traced sources, overlaid with the SMA 1.3 mm continuum emission contours, the same as in Fig. 1. The background color map shows the relative velocity to the systemic velocity of the source. The blue and red arrows represent the blueshifted and redshifted CO outflow axis, respectively. The dashed black lines indicate the velocity gradient orientation inferred from molecular line kinematics. Each panel is labeled with the species name and the excitation energy (in Kelvin) of the upper level of the transition. The label “disk candidate” on the bottom right marks the disk candidates in our sample.
Current usage metrics show cumulative count of Article Views (full-text article views including HTML views, PDF and ePub downloads, according to the available data) and Abstracts Views on Vision4Press platform.
Data correspond to usage on the plateform after 2015. The current usage metrics is available 48-96 hours after online publication and is updated daily on week days.
Initial download of the metrics may take a while.