Fig. 2
Download original image
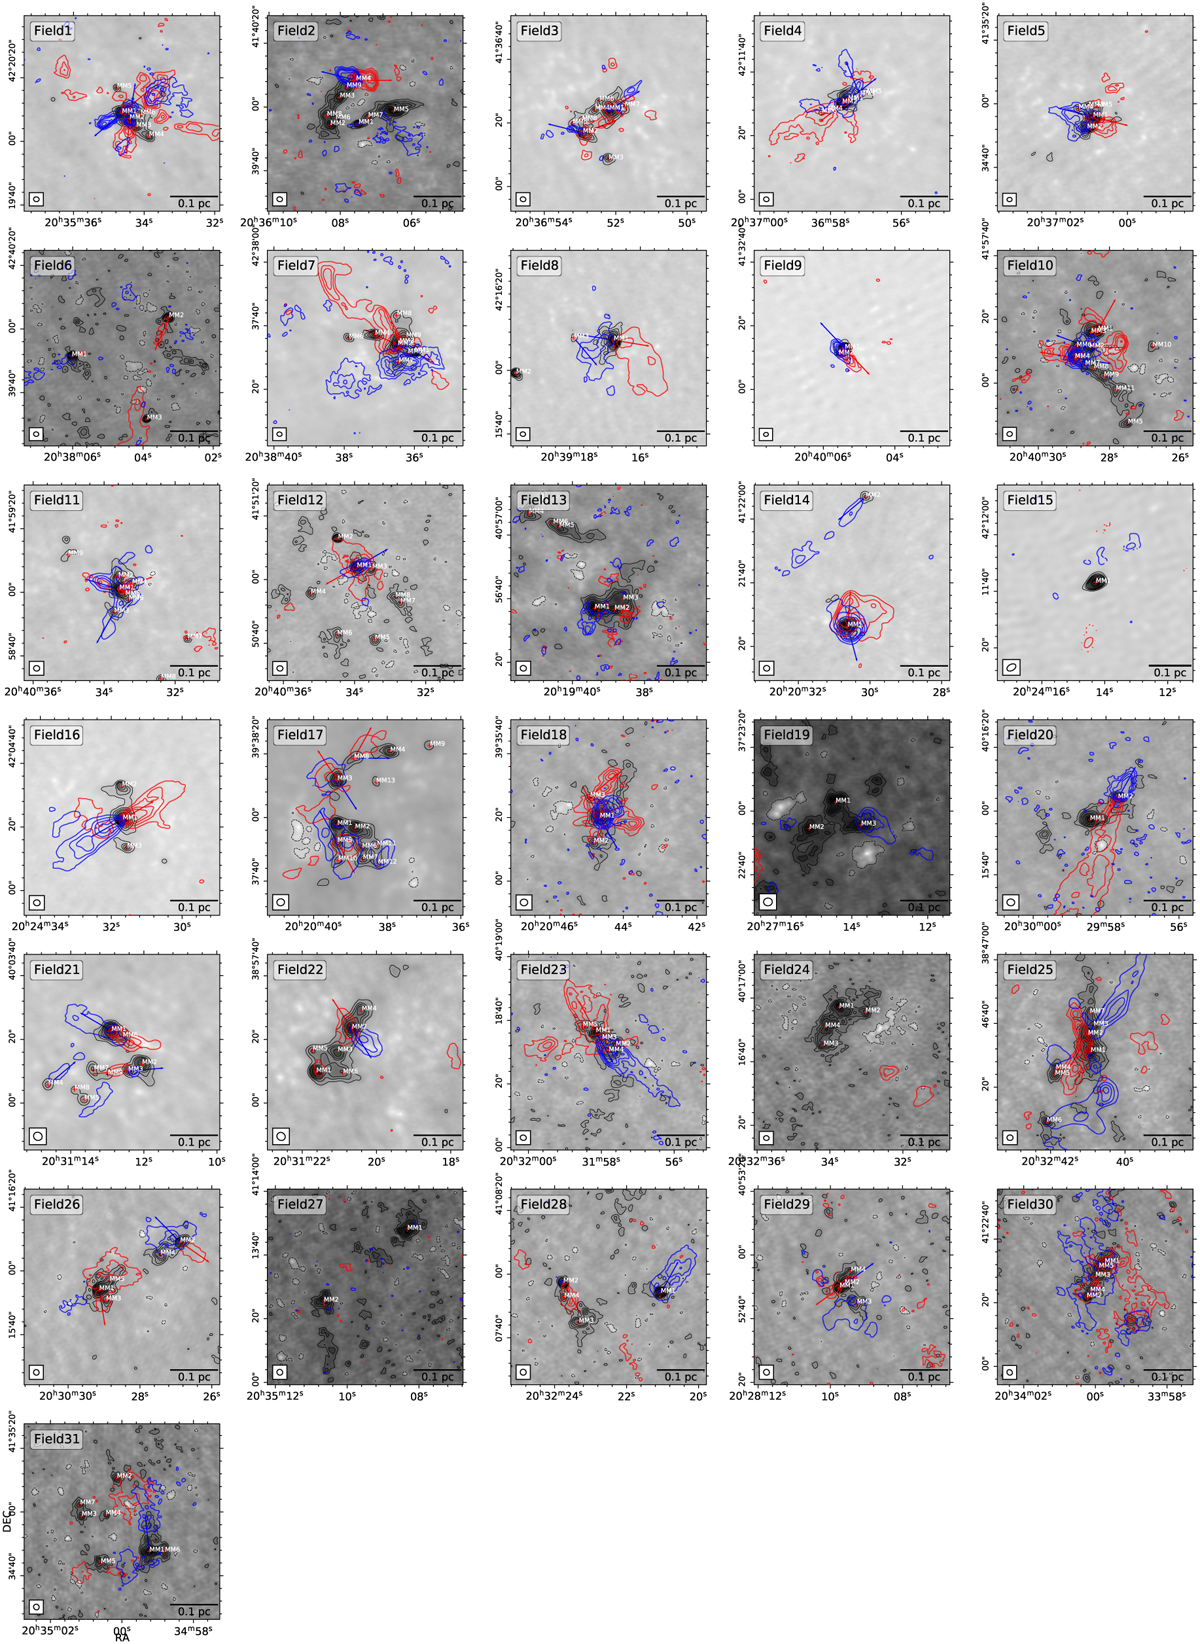
Molecular outflows detected in CO (2−1) in some sources. The blueshifted and redshifted outflows of CO (2−1) are plotted in blue and red contours, respectively. The contour levels are (−3, 3, 6, 9, 12, 15, 18, 24, 36, 48, 60)×σ, where σ is the rms of the integrated CO emission. The blue and red arrows mark the outflow axes identified in the region. The grayscale images and black contours show SMA 1.3 mm continuum emission. The contour levels are the same as in Fig. 1. The extracted dust condensation is marked by a black cross.
Current usage metrics show cumulative count of Article Views (full-text article views including HTML views, PDF and ePub downloads, according to the available data) and Abstracts Views on Vision4Press platform.
Data correspond to usage on the plateform after 2015. The current usage metrics is available 48-96 hours after online publication and is updated daily on week days.
Initial download of the metrics may take a while.