Open Access
Fig. B.1
Download original image
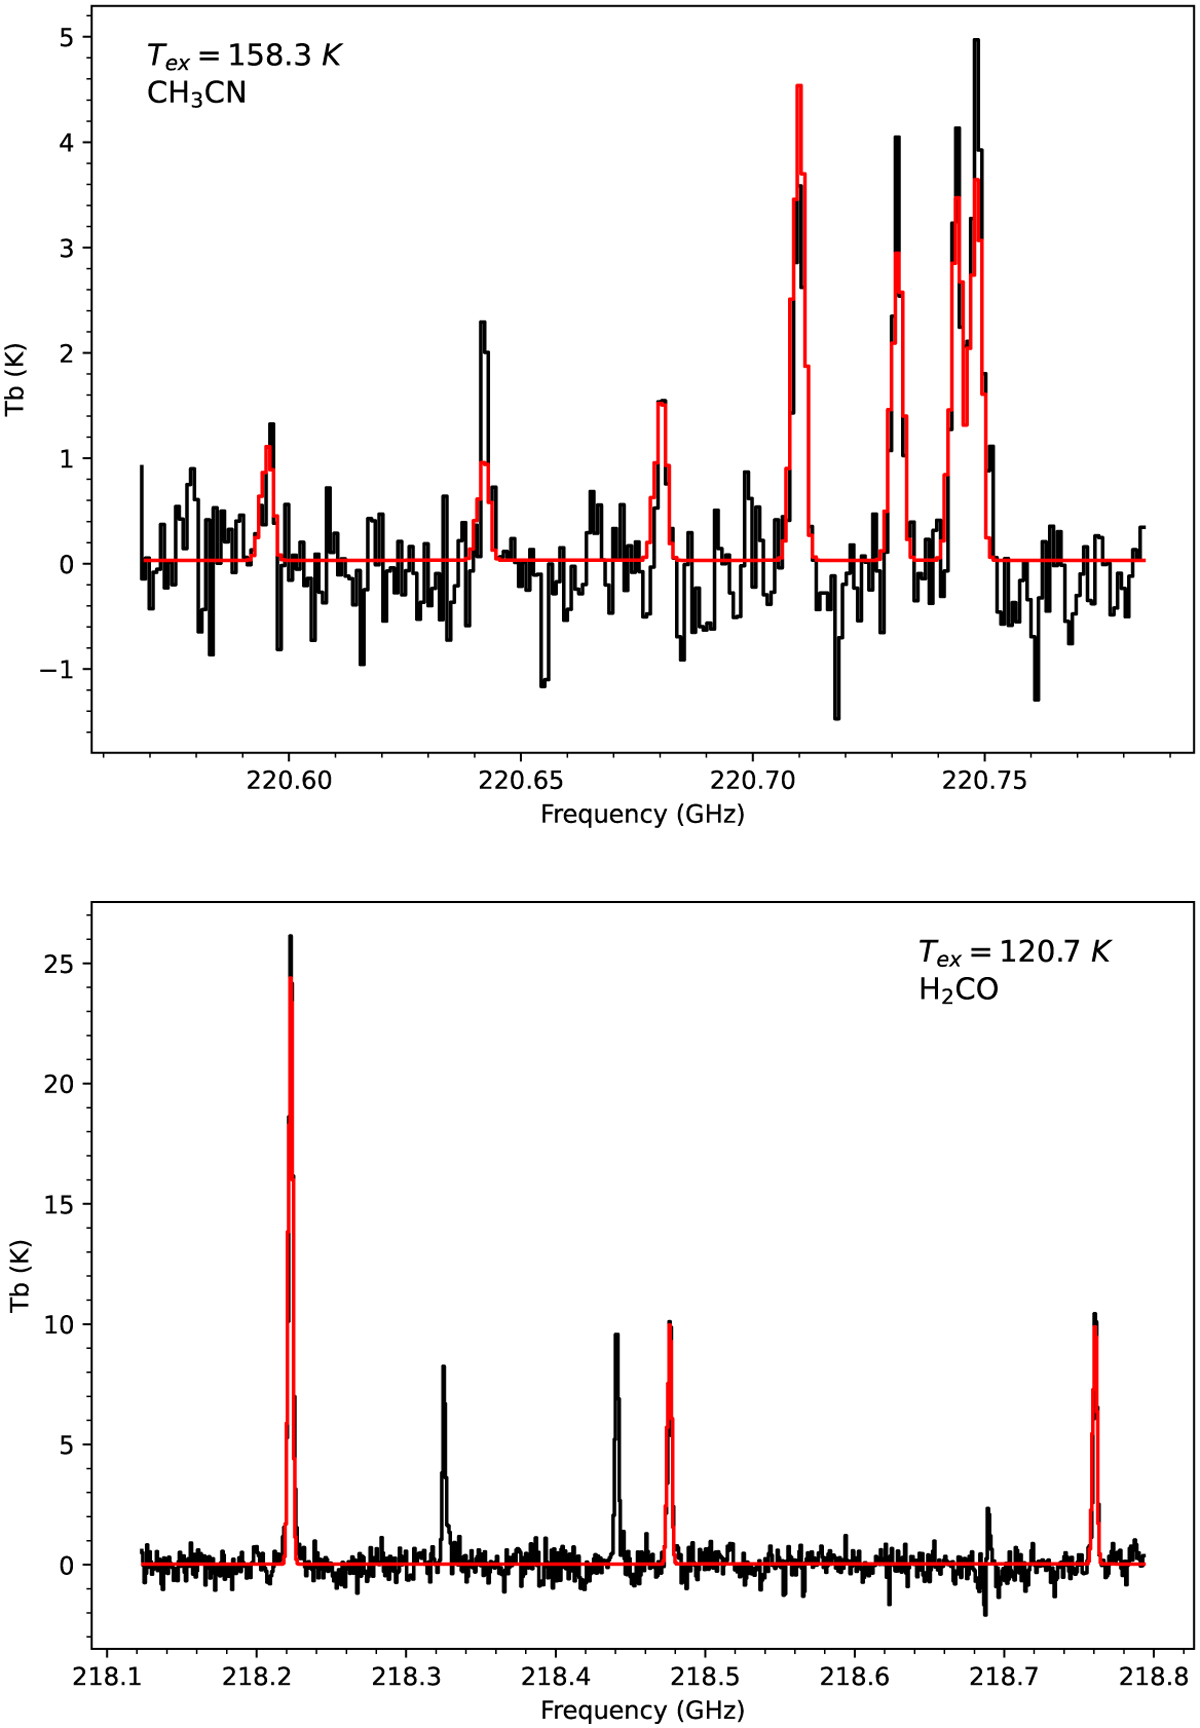
XCLASS fitting results of CH3CN and H2CO toward Field5 MM1. The black lines represent line emission averaged in the FWHM of the condensation. The red lines are the fitting results from XCLASS. The derived gas temperature from XCLASS is labeled in the map.
Current usage metrics show cumulative count of Article Views (full-text article views including HTML views, PDF and ePub downloads, according to the available data) and Abstracts Views on Vision4Press platform.
Data correspond to usage on the plateform after 2015. The current usage metrics is available 48-96 hours after online publication and is updated daily on week days.
Initial download of the metrics may take a while.