Fig. 1.
Download original image
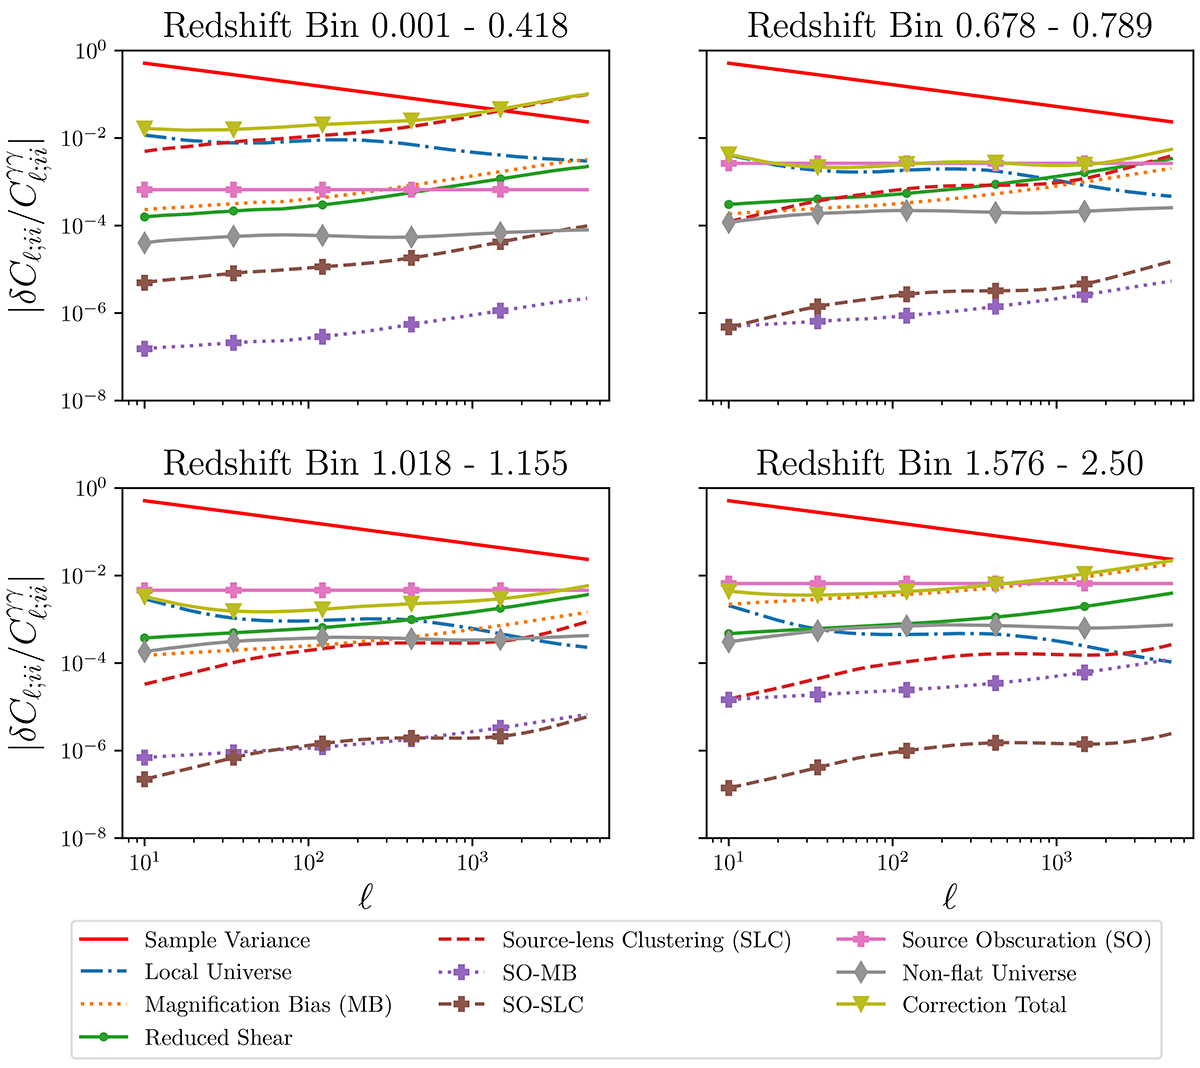
Absolute magnitudes of the reduced shear, source-lens clustering, magnification bias, local Universe, source obscuration, and non-flat Universe corrections to the shear angular power spectra, relative to those angular power spectra, for Euclid. The corrections to the angular power spectra for four redshift bin auto-correlations are shown as representative examples, spanning the redshift range of Euclid. The remaining auto and cross-correlations exhibit the same patterns. The absolute value of the signed sum of the corrections is also shown. These are all compared to the sample variance, calculated according to Eq. (61). Notably, while the magnitudes of individual corrections are either higher at lower redshifts or vice-versa, the magnitude of the sum of the corrections is consistently high. Additionally, the cross-terms between source obscuration, and magnification bias and source-lens clustering are multiple orders of magnitude below other terms and sample variance, suggesting they are negligible. The remainder of the terms are typically of similar magnitudes across redshifts, suggesting they must all be accounted for. We note that these magnitudes are for both the ΛCDM and w0waCDM cases, as the choice of fiducial values for the latter matches the former, and that the non-flat Universe correction here has been computed for a cosmology with ΩK = 0.05, whilst other corrections are when ΩK = 0. The markers for the SO-MB, SO-SLC, SO, Non-flat Universe, and total lines are only used to distinguish those from the other terms, and do not have any other significance. The symbols (points) are only included to allow a reader to distinguish the lines (in particular if printing in gray-scale) and do not indicate the ℓ-modes where a computation was made; all quantities were evaluated for 200 ℓ-bands, logarithmically spaced, with an ℓmin of 10, and an ℓmax of 5000.
Current usage metrics show cumulative count of Article Views (full-text article views including HTML views, PDF and ePub downloads, according to the available data) and Abstracts Views on Vision4Press platform.
Data correspond to usage on the plateform after 2015. The current usage metrics is available 48-96 hours after online publication and is updated daily on week days.
Initial download of the metrics may take a while.