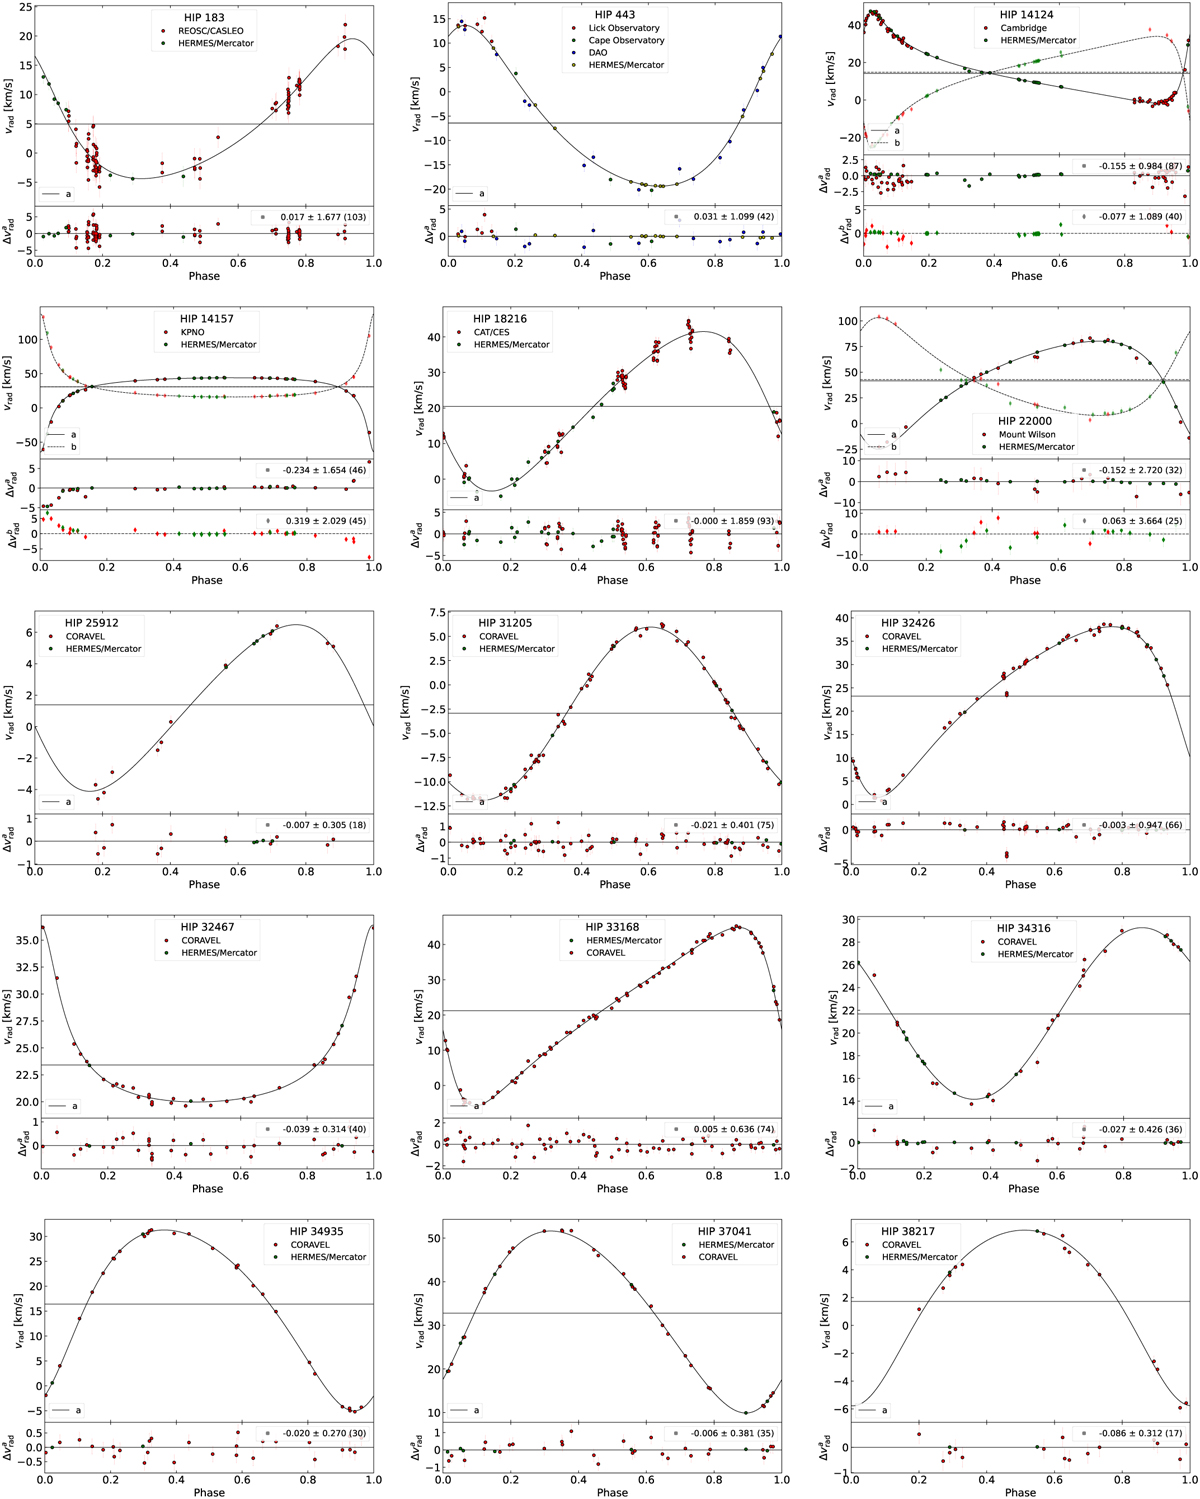
Fig. A.1
Download original image
Revised spectroscopic orbits except for HIP 12390, 28816, 73182 and 111170 for which a simultaneous adjustment of the visual and spectroscopic orbits are displayed in Figs. 1, 2, 4, and 6. The bottom panels display the residuals and the insert list their average, standard deviation, and number of data points (between parentheses). The two plots displayed for HIP 55505 correspond to component A and component B.
Current usage metrics show cumulative count of Article Views (full-text article views including HTML views, PDF and ePub downloads, according to the available data) and Abstracts Views on Vision4Press platform.
Data correspond to usage on the plateform after 2015. The current usage metrics is available 48-96 hours after online publication and is updated daily on week days.
Initial download of the metrics may take a while.