Fig. 1
Download original image
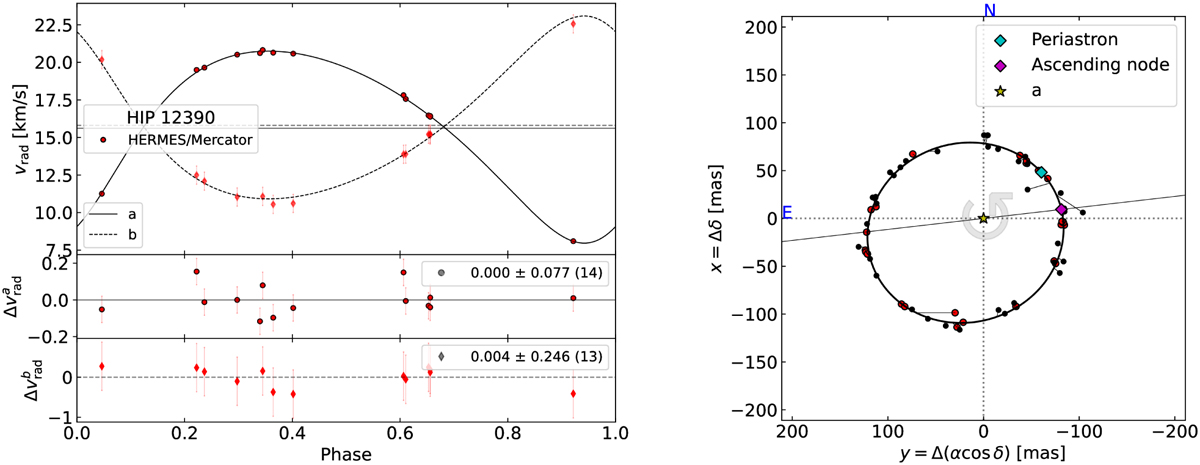
HIP 12390 spectroscopic orbit (left panel) with HERMES data points alone, which allow a better separation between the two components than the earlier, lower resolution data from CORAVEL (Duquennoy & Mayor 1988). The right panel shows the simultaneous visual solution. The red dots represent measurements used in the derived solution that is mostly based on data acquired after 1975. The red diamonds in the left panel correspond to the component listed as ‘2’ in Table 4, which has a wider (7.4 km s–1, after correction for the instrumental width of 3 km s–1), but less contrasted contribution to the cross-correlation profile. Component A has a cross-correlation profile consistent with the instrumental width.
Current usage metrics show cumulative count of Article Views (full-text article views including HTML views, PDF and ePub downloads, according to the available data) and Abstracts Views on Vision4Press platform.
Data correspond to usage on the plateform after 2015. The current usage metrics is available 48-96 hours after online publication and is updated daily on week days.
Initial download of the metrics may take a while.