Fig. 3
Download original image
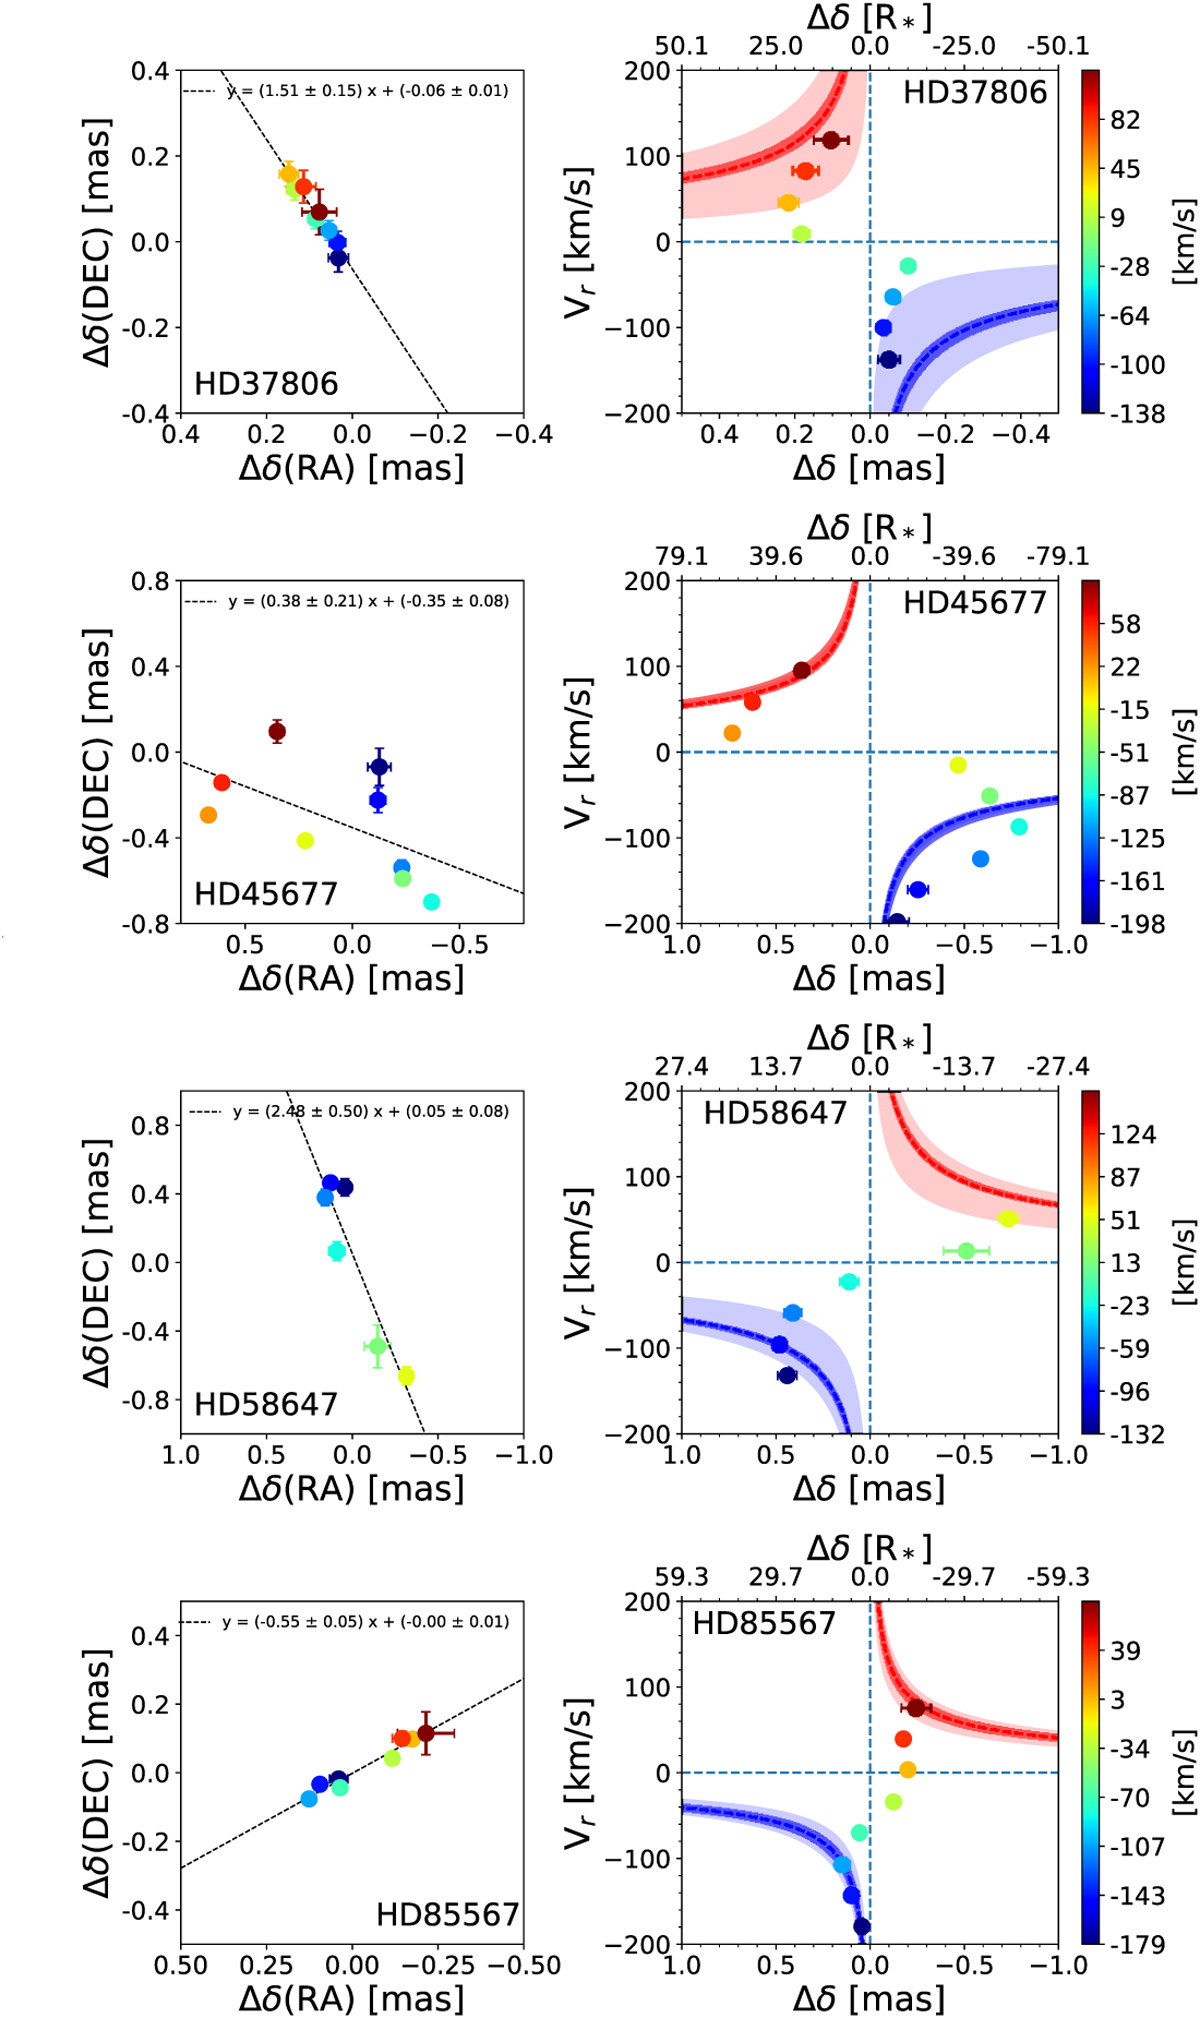
Two-dimensional displacements (left panel) and PVD (right panel) for HD 37806, HD 45677, HD 58647, and HD 85567 as computed from the differential phase and described in Sect. 4.4. The data are colour-coded according to the radial velocity (scale on the right). In the 2D-displacement figures, the dashed lines show the best linear fit reported at the top of the panel. In the PVD panels, the blue and red shaded regions show the Keplerian rotation pattern (see text for more details).
Current usage metrics show cumulative count of Article Views (full-text article views including HTML views, PDF and ePub downloads, according to the available data) and Abstracts Views on Vision4Press platform.
Data correspond to usage on the plateform after 2015. The current usage metrics is available 48-96 hours after online publication and is updated daily on week days.
Initial download of the metrics may take a while.