Fig. B.1
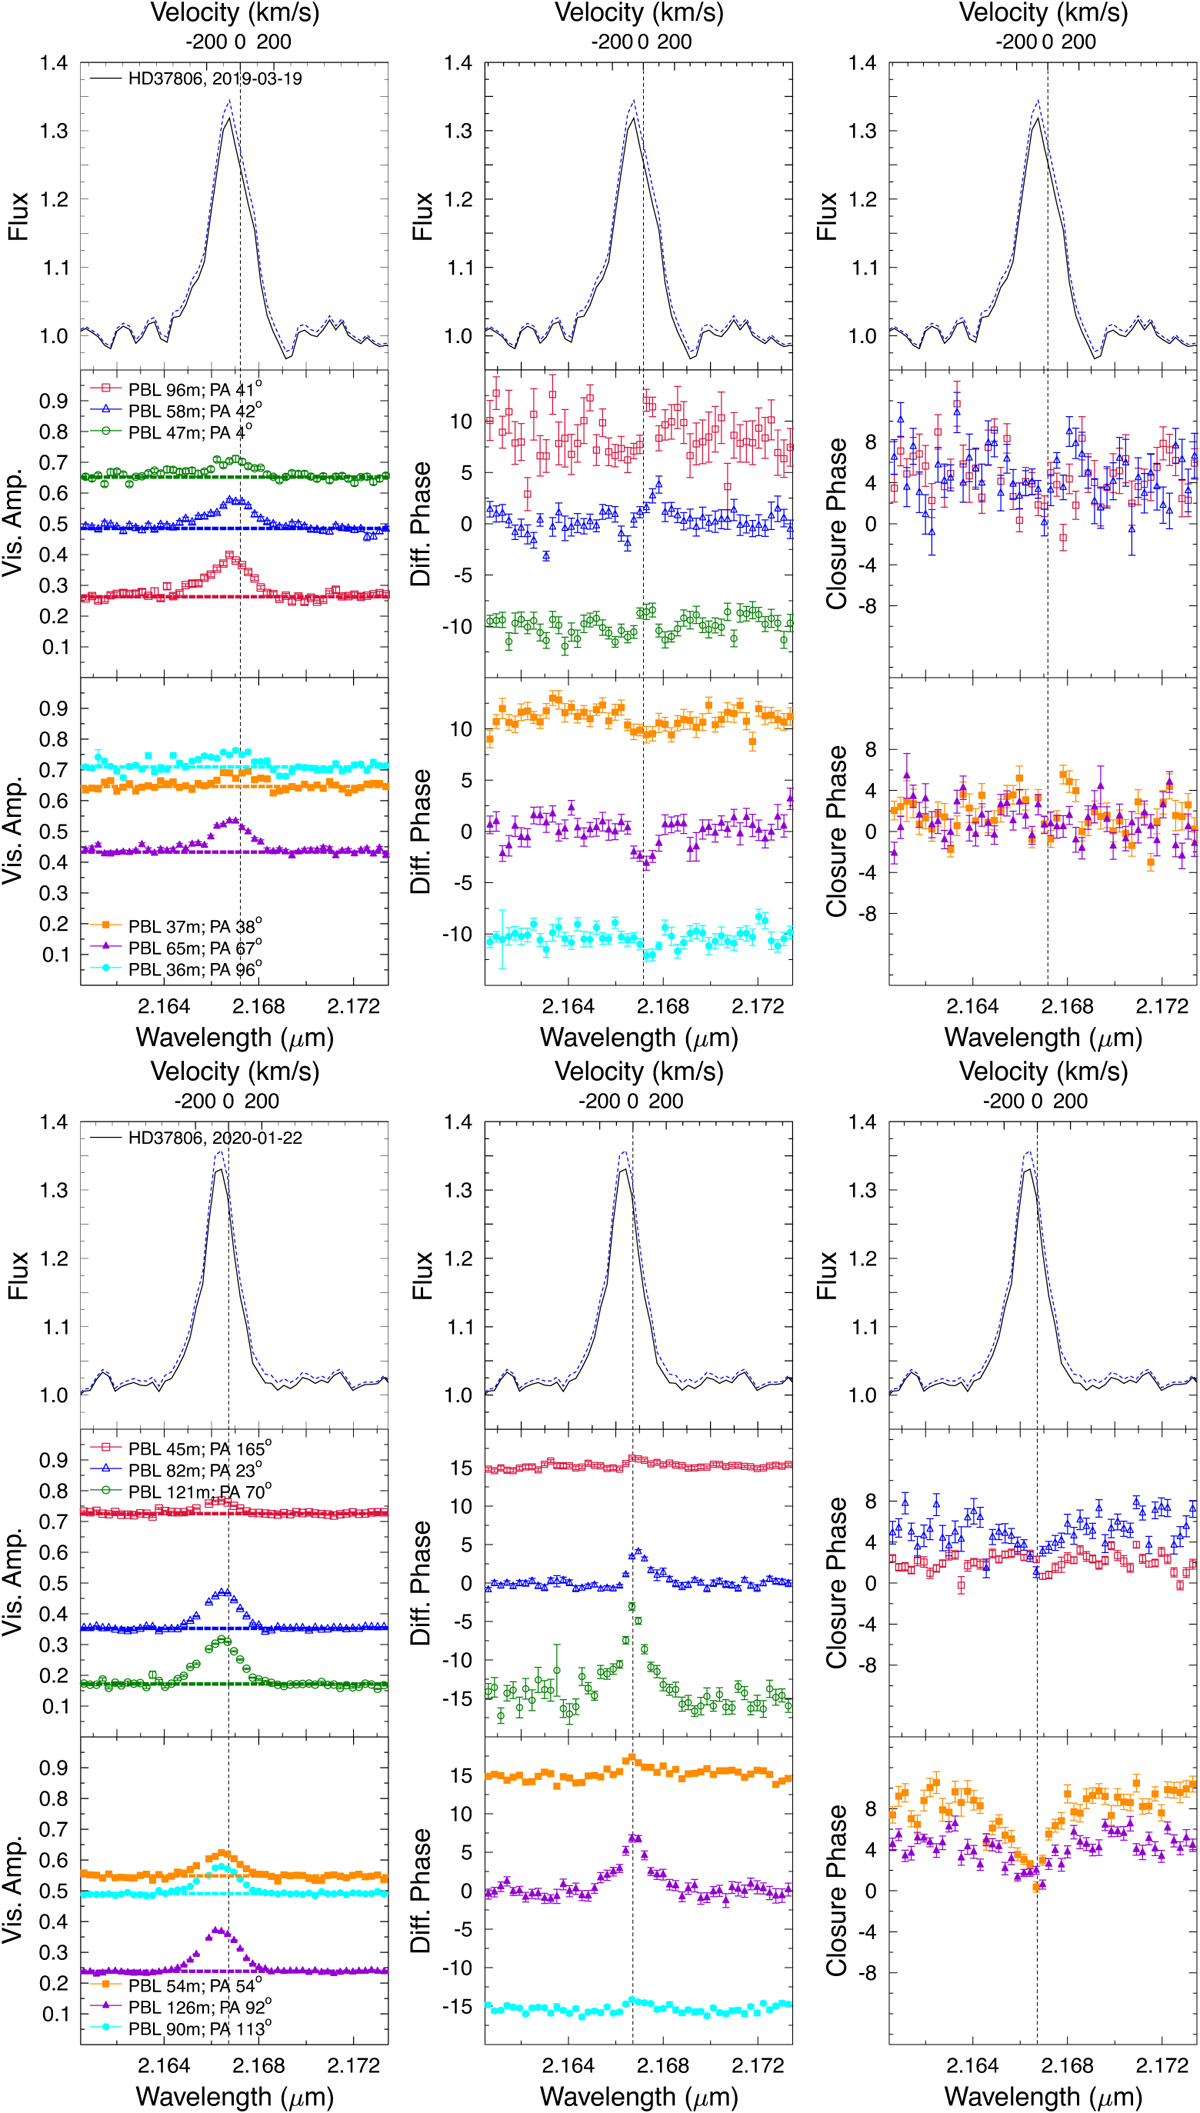
Download original image
VLTI-GRAVITY HR interferometric observables for the star HD 37806. Each set of figures shows observations for a different date, indicated in the top-left panel. The three columns in each figure show the visibility amplitude (left), differential phase (middle), and closure phase (right). As reference, the observed (black solid line) and photospheric corrected (dahsed blue line) Brγ line profiles are shown at the top of each panel. Vertical dashed lines indicate the location of the zero velocity with respect to the local standard of rest.
Current usage metrics show cumulative count of Article Views (full-text article views including HTML views, PDF and ePub downloads, according to the available data) and Abstracts Views on Vision4Press platform.
Data correspond to usage on the plateform after 2015. The current usage metrics is available 48-96 hours after online publication and is updated daily on week days.
Initial download of the metrics may take a while.