Open Access
Fig. A.2
Download original image
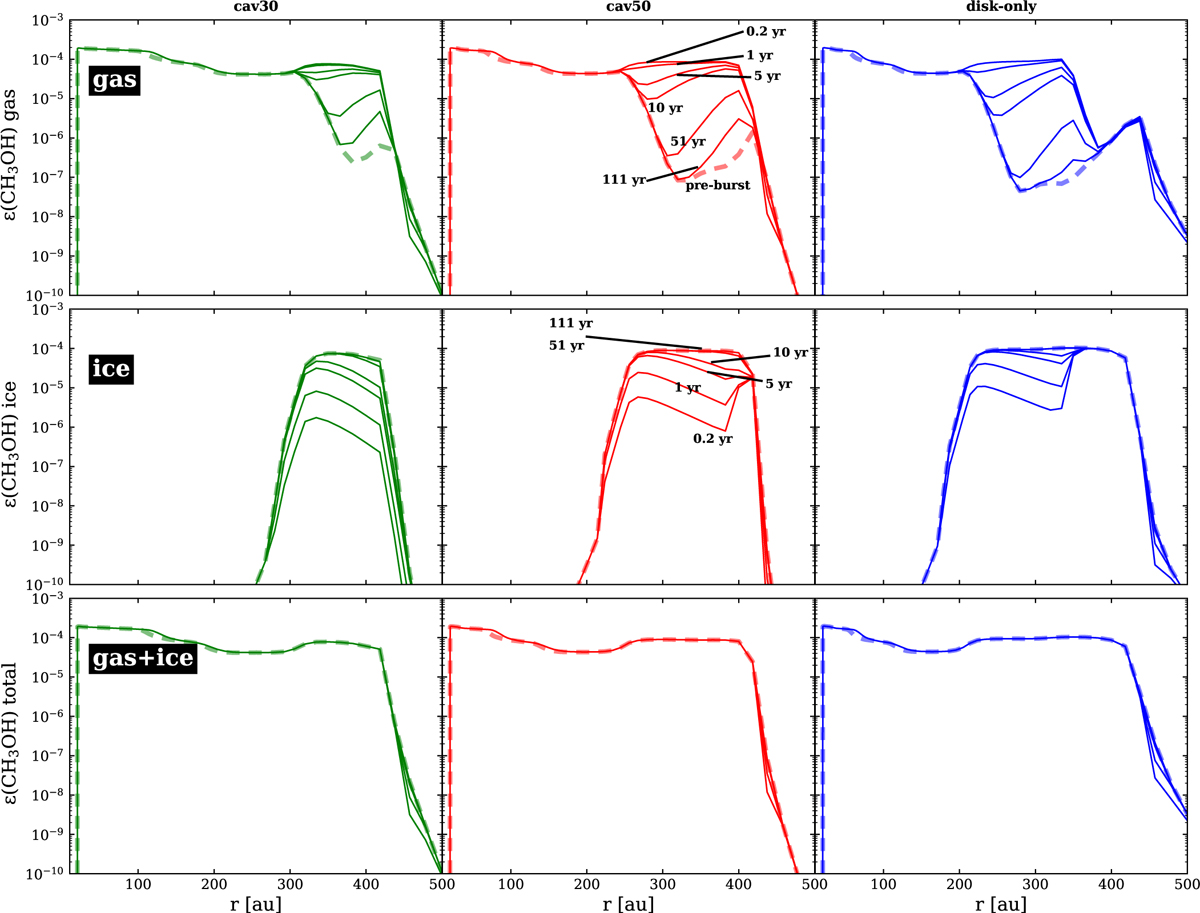
Averaged abundances of water for models cav30 (green, left column), cav50 (red, middle column), and disk-only (blue, right column) during the post-burst phase. Six different time steps during the post-burst are displayed. The top, middle, and bottom rows show the averaged gas, ice, and total abundances, respectively.
Current usage metrics show cumulative count of Article Views (full-text article views including HTML views, PDF and ePub downloads, according to the available data) and Abstracts Views on Vision4Press platform.
Data correspond to usage on the plateform after 2015. The current usage metrics is available 48-96 hours after online publication and is updated daily on week days.
Initial download of the metrics may take a while.