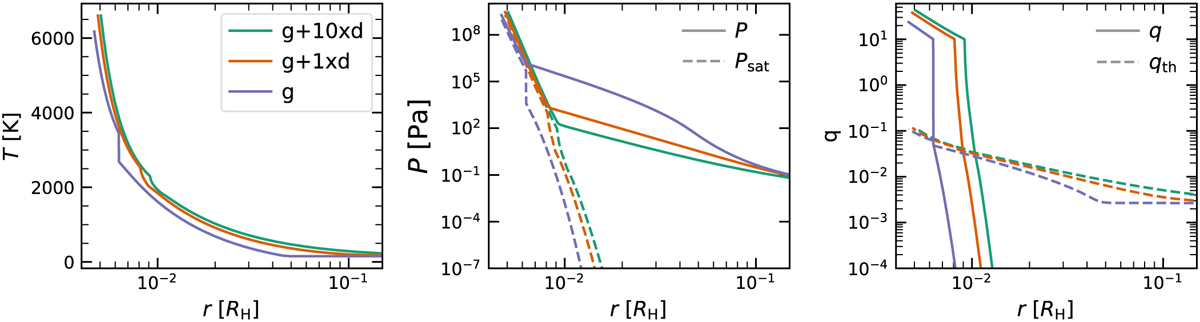
Fig. 4
Download original image
Comparison of the temperature, pressure, and SiO mass mixing ratio profiles of a planet with Mpl = 0.8 M⊕ for three different treatments of the opacity. The model “g+1xd” corresponds to the nominal case. In model “g+10xd”, the dust contribution is increased by a factor 10. In model “g”, the gas is the only opacity source considered. Due to the larger outer isothermal region in model “g”, the temperature in the envelope is lower than in the other models while the pressure is higher.
Current usage metrics show cumulative count of Article Views (full-text article views including HTML views, PDF and ePub downloads, according to the available data) and Abstracts Views on Vision4Press platform.
Data correspond to usage on the plateform after 2015. The current usage metrics is available 48-96 hours after online publication and is updated daily on week days.
Initial download of the metrics may take a while.