Fig. 1.
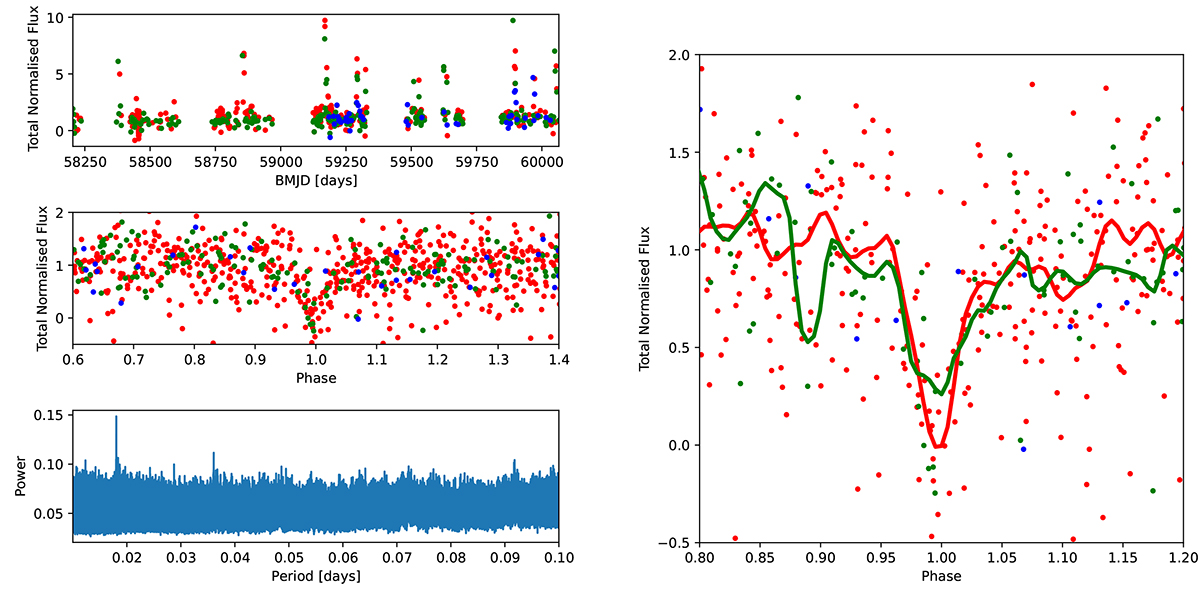
Download original image
ZTF data of ZTF20aabowdt. On the left, the upper panel shows the light curve, the middle panel shows the folded light curve (P = 25.98 min), and the final panel shows the periodogram. The median uncertainty on the ZTF measurements is 33% and is not shown, for clarity. On the right is a zoomed-in view of the eclipse of the folded light curve. The smoothed light curve (using a Gaussian kernel) is overplotted. Legend: The data from the g, r, and i bands are shown in green, red, and blue.
Current usage metrics show cumulative count of Article Views (full-text article views including HTML views, PDF and ePub downloads, according to the available data) and Abstracts Views on Vision4Press platform.
Data correspond to usage on the plateform after 2015. The current usage metrics is available 48-96 hours after online publication and is updated daily on week days.
Initial download of the metrics may take a while.