Fig. 9.
Download original image
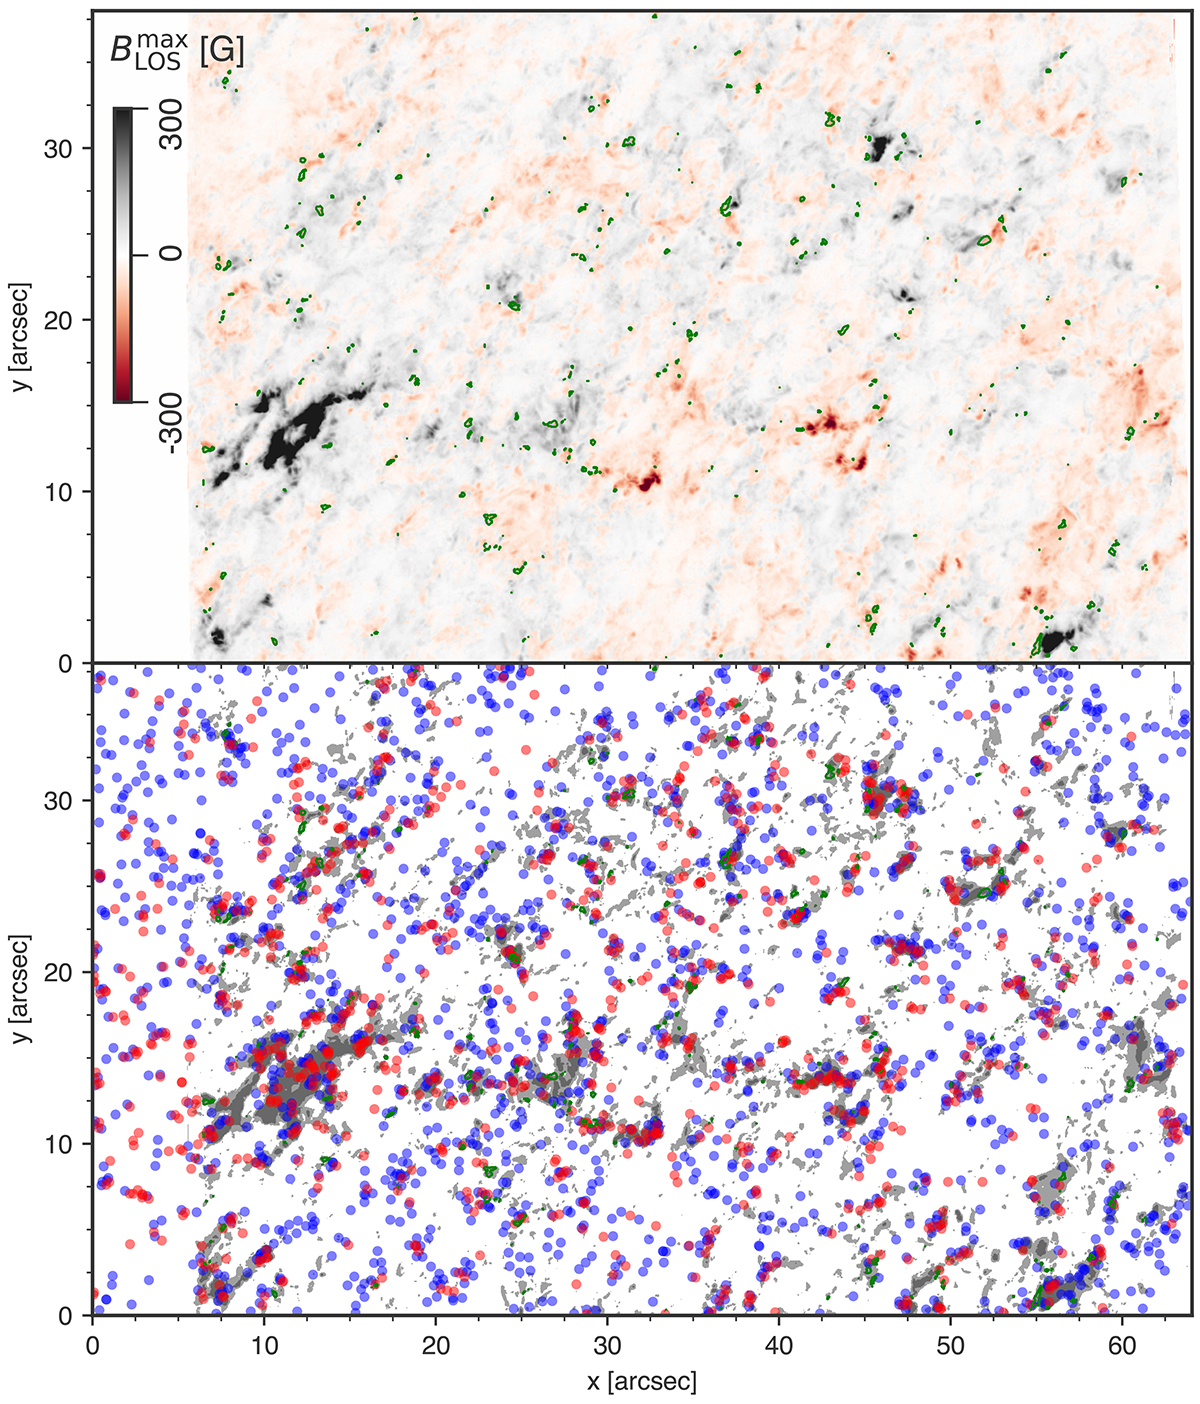
Spatial distribution of QSEBs and their magnetic environment. The top panel shows at each pixel the extremum of BLOS over the full 24 min duration of the time series. Green contours mark pixels that have |BLOS|> 50 G for both polarities during the time series. The bottom panel shows QSEB detections in Hβ (red) and Hε (blue). There are 961 QSEBs in Hβ and 1674 QSEBs in Hε. The shaded background marks regions where ![]() G (dark gray) and
G (dark gray) and ![]() G (light gray). The CRISP FOV is slightly narrower than for CHROMIS, so that the region for x < 6″ is not covered by the magnetic field map.
G (light gray). The CRISP FOV is slightly narrower than for CHROMIS, so that the region for x < 6″ is not covered by the magnetic field map.
Current usage metrics show cumulative count of Article Views (full-text article views including HTML views, PDF and ePub downloads, according to the available data) and Abstracts Views on Vision4Press platform.
Data correspond to usage on the plateform after 2015. The current usage metrics is available 48-96 hours after online publication and is updated daily on week days.
Initial download of the metrics may take a while.