Fig. 8.
Download original image
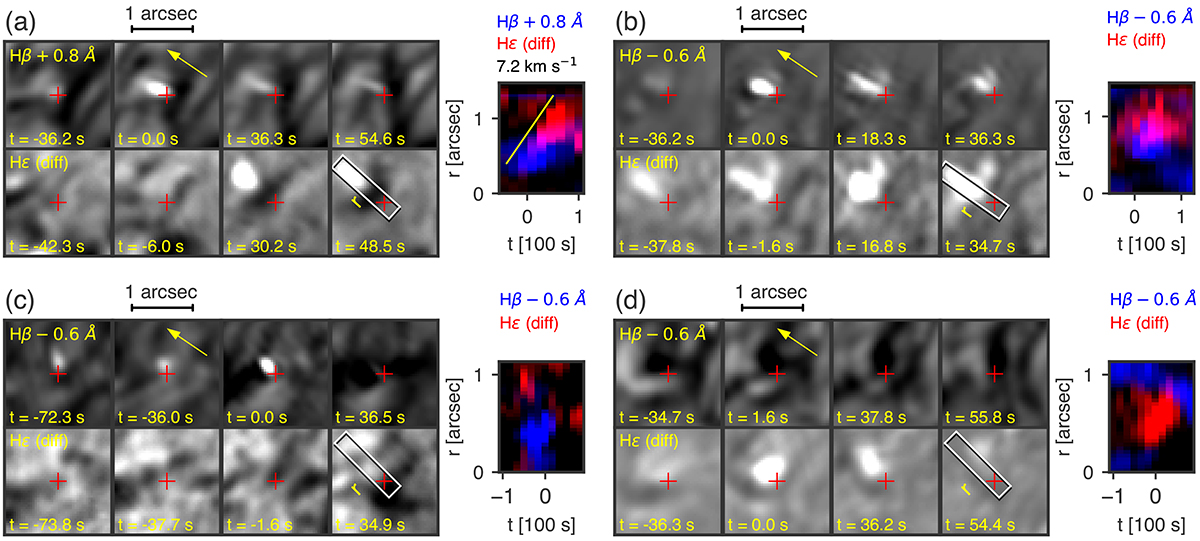
Examples of the temporal evolution of QSEBs. (a) QSEB first observed in Hβ and then in Hε. (b) QSEB first observed in Hε and then in Hβ. (c) QSEB observed in Hβ alone. (d) QSEB observed in Hε alone. The bottom row of images shows difference (Hε − Ca II H blue wing) images. White shows emission in Hε. Each image is scaled individually. The bottom right panels show a rectangular box along which a space-time diagram along the distance r is shown in the right panels. The yellow arrows indicate the direction toward the limb, so that r = 1 is closer to the limb.
Current usage metrics show cumulative count of Article Views (full-text article views including HTML views, PDF and ePub downloads, according to the available data) and Abstracts Views on Vision4Press platform.
Data correspond to usage on the plateform after 2015. The current usage metrics is available 48-96 hours after online publication and is updated daily on week days.
Initial download of the metrics may take a while.