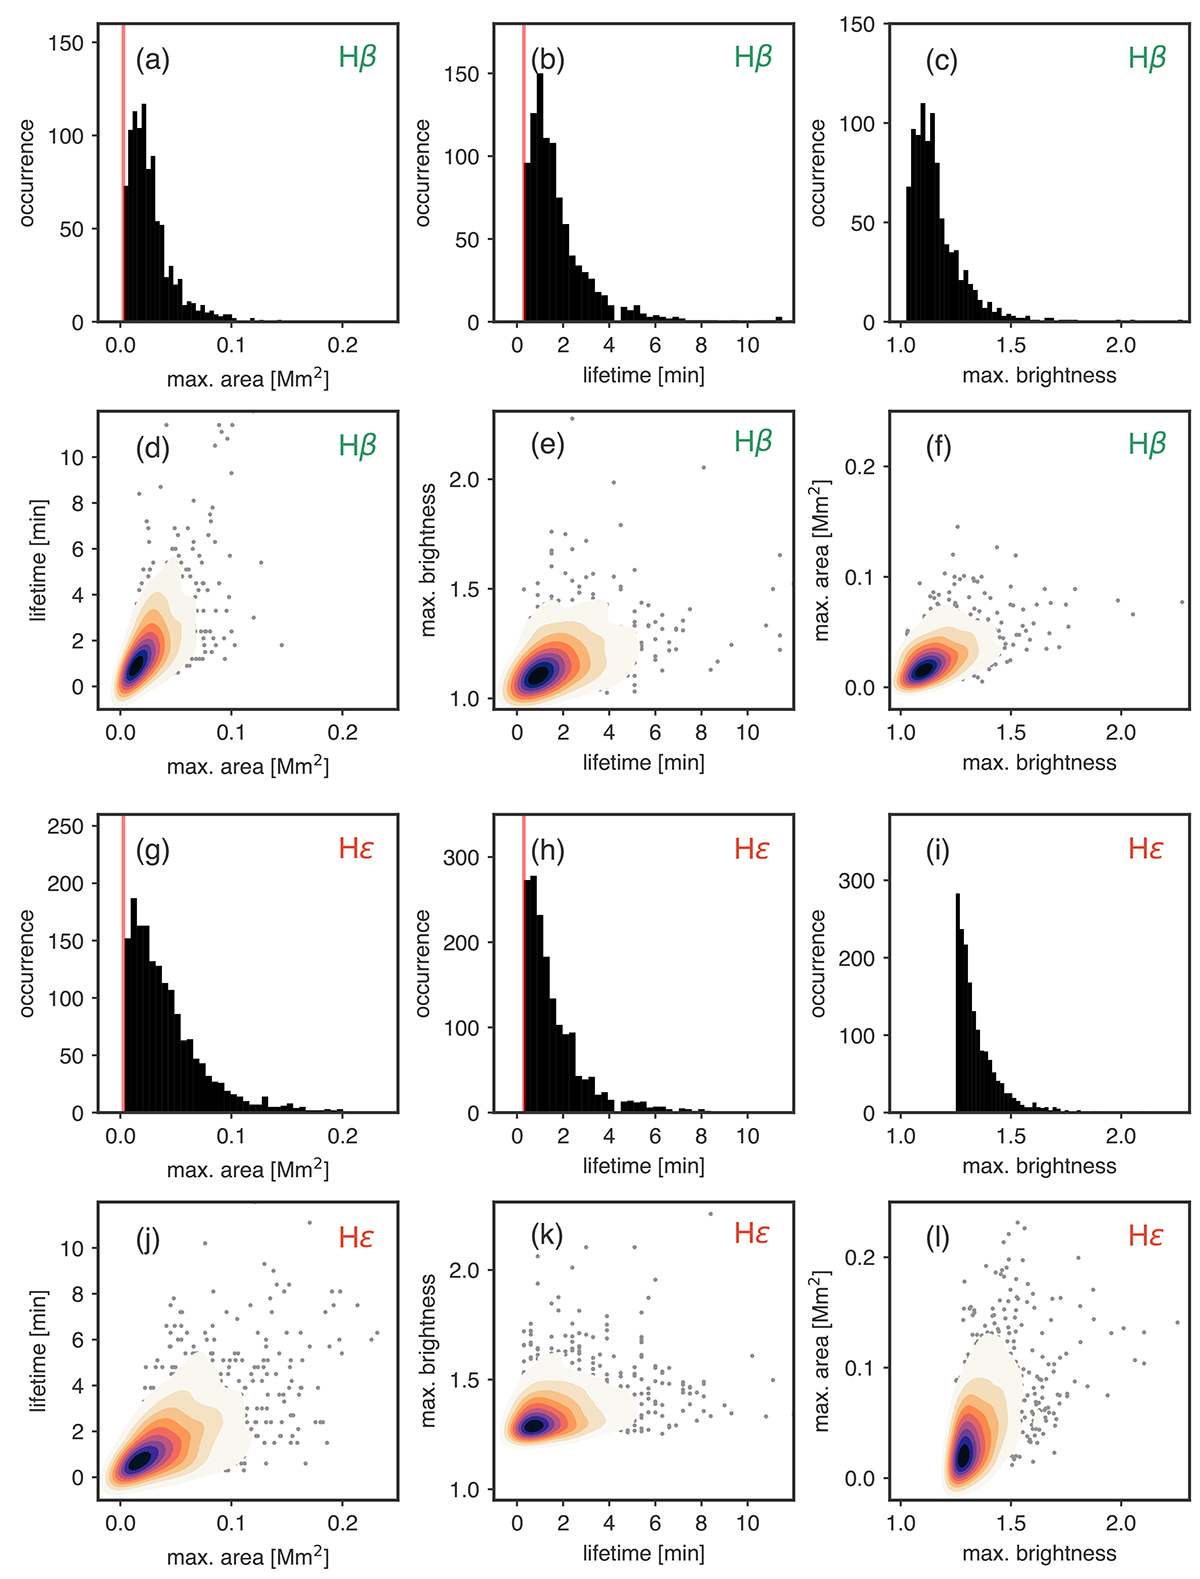
Fig. 5.
Download original image
Statistical properties of QSEBs detected in the 24 min time series on 16 August 2020. The total number of Hβ QSEBs is 961, and the number of Hε QSEBs is 1674. The filled black histograms in panels (a)–(c) and (g)–(i) represent the maximum area, lifetime, and maximum brightness distributions, respectively. The vertical red line marks the lower limit set by the sampling: 0.0008 mm2 (one pixel) in area (panels (a) and (g)) and 18 s in lifetime (panels (b) and (h)). In panels (d)–(f) and (j)–(l), multivariate JPDFs and scatter plots between the maximum area, lifetime, and maximum brightness are shown. The dark blue shade of the JPDFs indicates where the highest density occurs, and the lighter orange shaded regions represent the low-density distribution.
Current usage metrics show cumulative count of Article Views (full-text article views including HTML views, PDF and ePub downloads, according to the available data) and Abstracts Views on Vision4Press platform.
Data correspond to usage on the plateform after 2015. The current usage metrics is available 48-96 hours after online publication and is updated daily on week days.
Initial download of the metrics may take a while.