Fig. 4.
Download original image
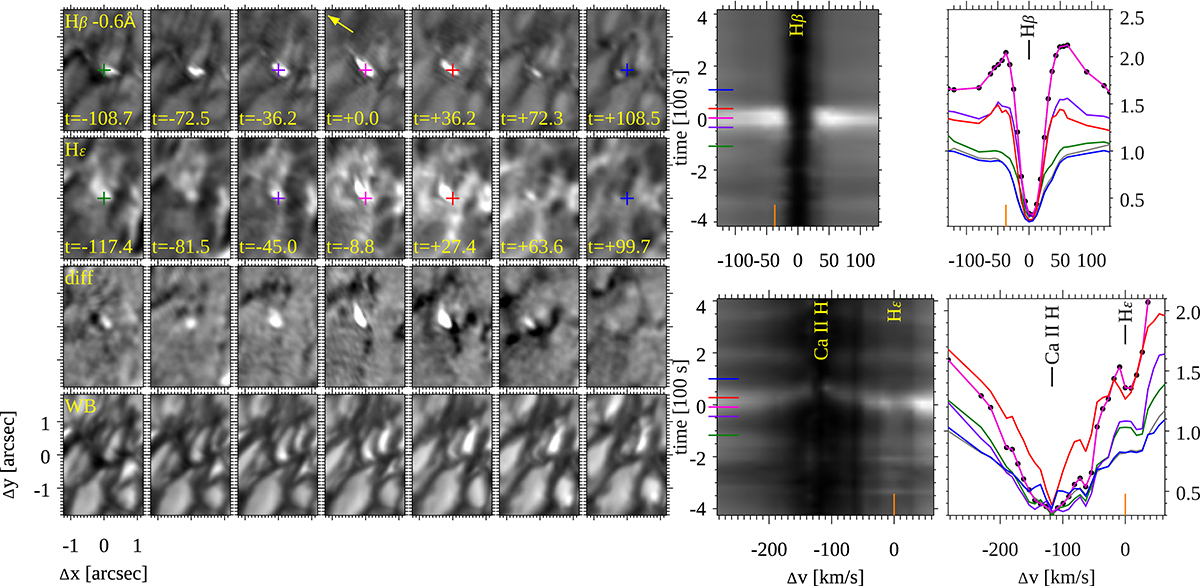
Temporal evolution of a QSEB observed at μ = 0.54 on 16 August 2020. On the left, a series of small images are centered on a QSEB (from the top to bottom row) in the Hβ wing, the Hε line center, the difference Hε − Ca II H blue wing, and WB 4846 Å. The λt diagrams to the right show the spectral evolution at the pixel location marked with a cross in the Hβ wing and Hε images. The colored markers indicate the times for which spectral profiles are shown on the right. An animation of this figure is available online.
Current usage metrics show cumulative count of Article Views (full-text article views including HTML views, PDF and ePub downloads, according to the available data) and Abstracts Views on Vision4Press platform.
Data correspond to usage on the plateform after 2015. The current usage metrics is available 48-96 hours after online publication and is updated daily on week days.
Initial download of the metrics may take a while.