Fig. 2.
Download original image
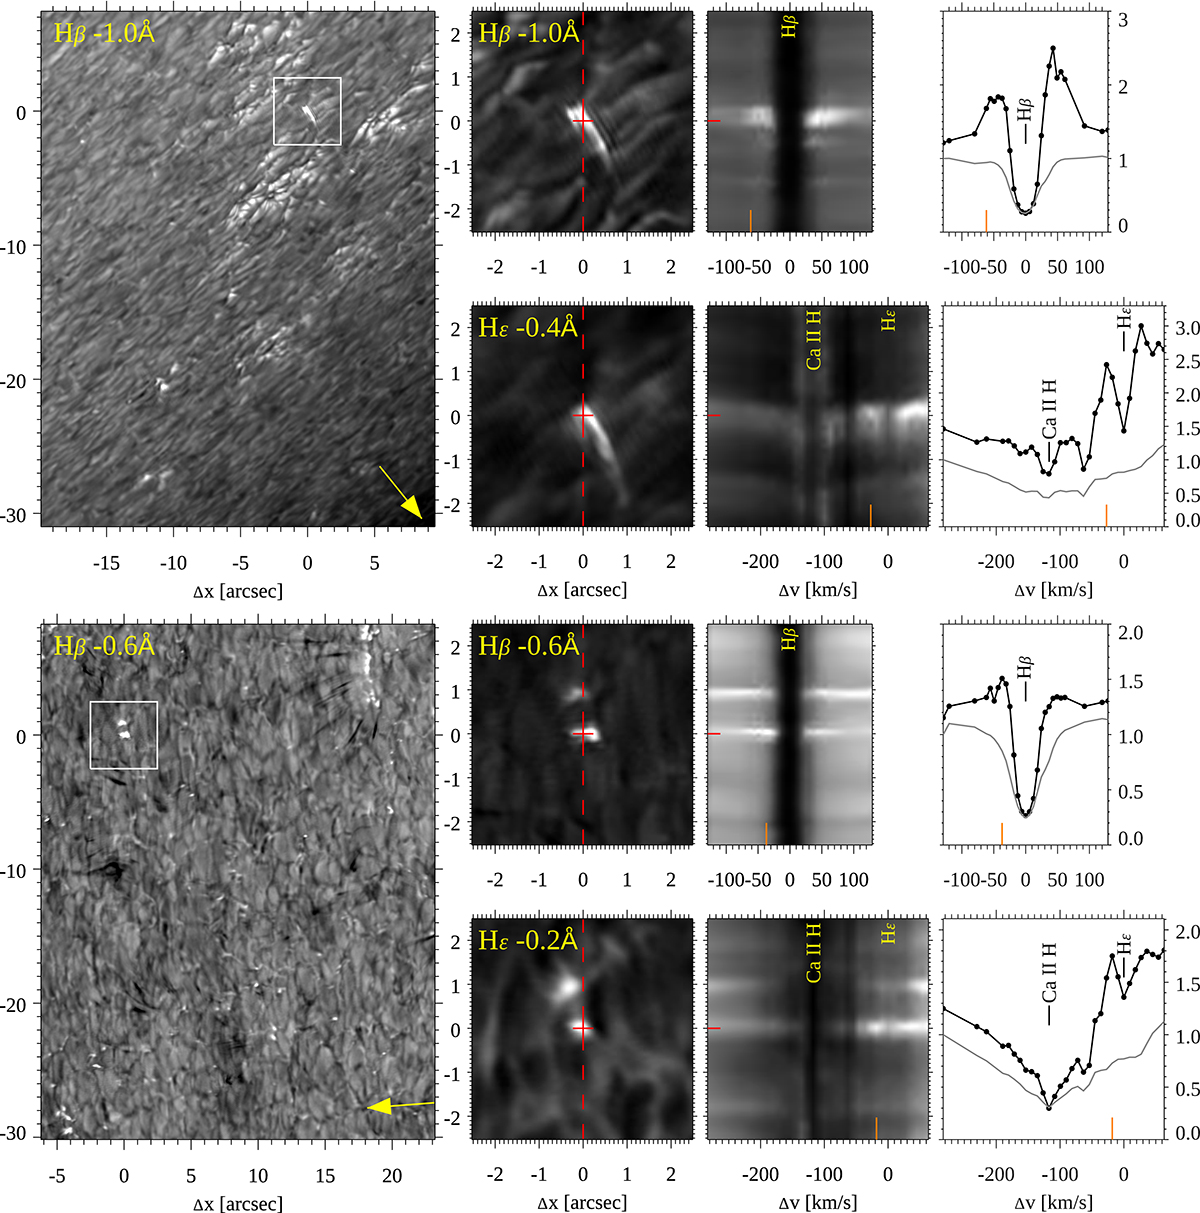
Examples of EBs in a small active region (top, 13 August 2020) and in the quiet Sun (bottom, 15 August 2020). Both examples are close to the limb (top: μ = 0.32, bottom: μ = 0.49). The small white square in the overview images (left) are centered on the EBs shown at larger magnification in the Hβ and Hε wing images in the next column. The yellow arrow in the lower-right corner of the overview image shows the direction toward the closest limb. The λy spectrogram is shown for the vertical dashed red line in the center of the wing images and crosses the EB. The spectral profiles are shown for the center position, which is marked with the short horizontal red dash in the spectrogram. The thin gray profiles are reference spectral profiles averaged over the full region shown in the left context images. Animations that show the full spectral line scans of the two examples are available online.
Current usage metrics show cumulative count of Article Views (full-text article views including HTML views, PDF and ePub downloads, according to the available data) and Abstracts Views on Vision4Press platform.
Data correspond to usage on the plateform after 2015. The current usage metrics is available 48-96 hours after online publication and is updated daily on week days.
Initial download of the metrics may take a while.