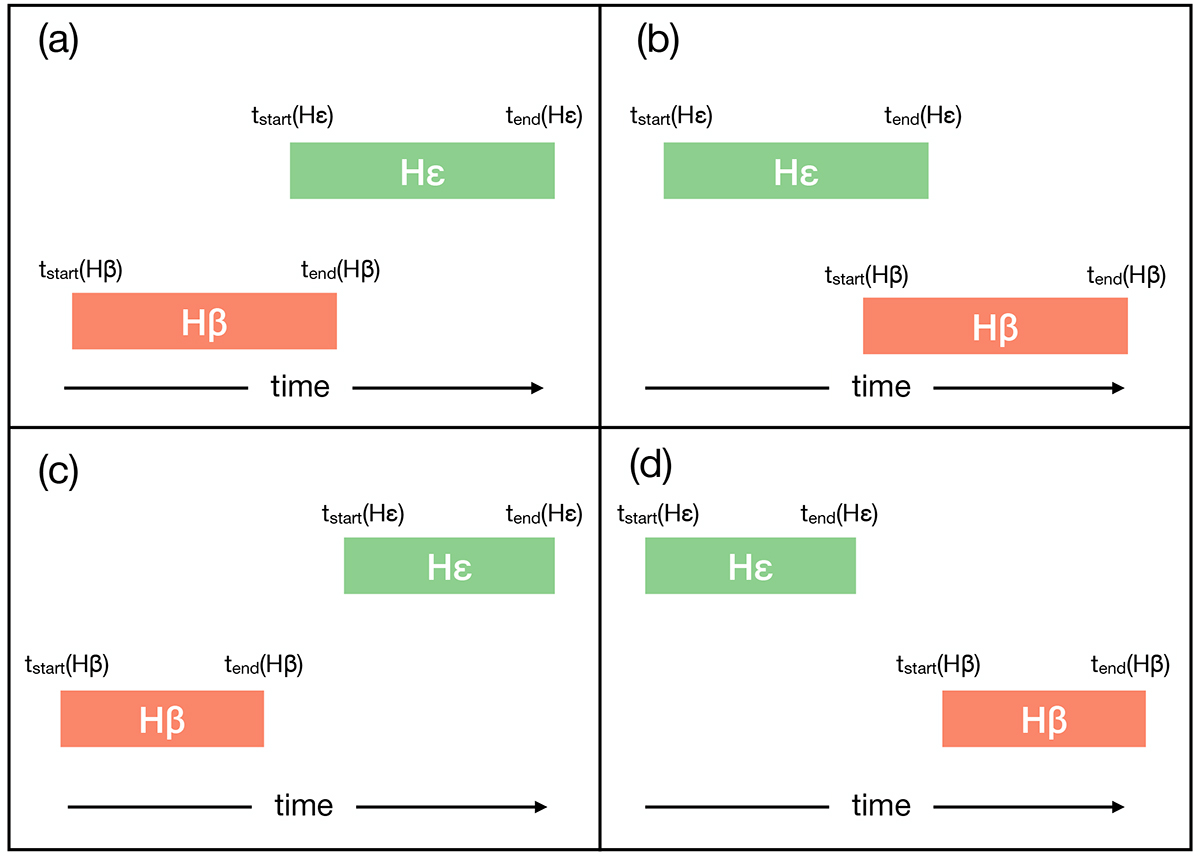
Fig. A.3.
Download original image
Connecting Hβ and Hε QSEB detections in time. Four different cases are shown, and the duration of a QSEB detection is illustrated with colored bars. The spatial connection is not illustrated, but we assumed that the Hβ and Hε detections are spatially connected. The cases in panel (a) and (b) overlap temporally and are therefore clearly temporally connected. The cases in panels (c) and (d) have a time gap between the detections and need to satisfy a temporal condition in order to be considered a connected event.
Current usage metrics show cumulative count of Article Views (full-text article views including HTML views, PDF and ePub downloads, according to the available data) and Abstracts Views on Vision4Press platform.
Data correspond to usage on the plateform after 2015. The current usage metrics is available 48-96 hours after online publication and is updated daily on week days.
Initial download of the metrics may take a while.