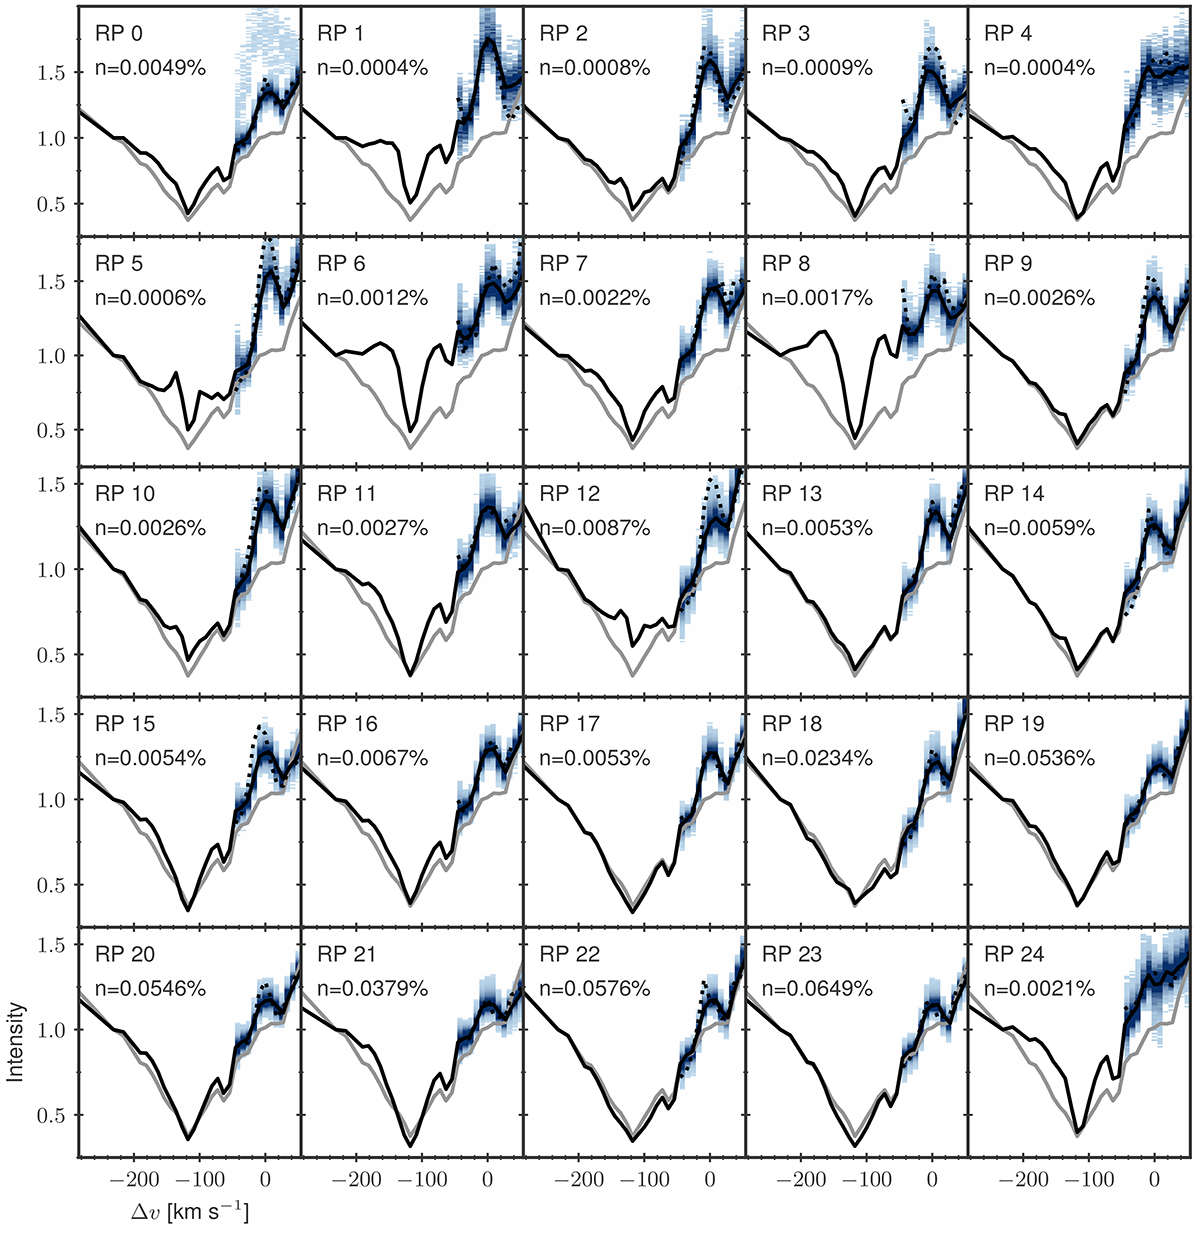
Fig. A.2.
Download original image
Twenty-five RPs (solid black lines) from the k-means clustering of the Hε line that are identified as a signature of QSEB. The k-means clustering was performed for 13 line positions around the Hε nominal line core. The shaded colored areas represent the density distribution of Hε spectra within a cluster. The dotted black line shows the Hε profile that is farthest (measured in Euclidean distance) from the corresponding RP within a particular cluster. The average quiet-Sun profile (gray line) is plotted in each panel as reference. The parameter n represents the number of spectral profiles in a cluster as the percentage of the total of ∼1.7 × 10⁹ spectra.
Current usage metrics show cumulative count of Article Views (full-text article views including HTML views, PDF and ePub downloads, according to the available data) and Abstracts Views on Vision4Press platform.
Data correspond to usage on the plateform after 2015. The current usage metrics is available 48-96 hours after online publication and is updated daily on week days.
Initial download of the metrics may take a while.