Fig. 10.
Download original image
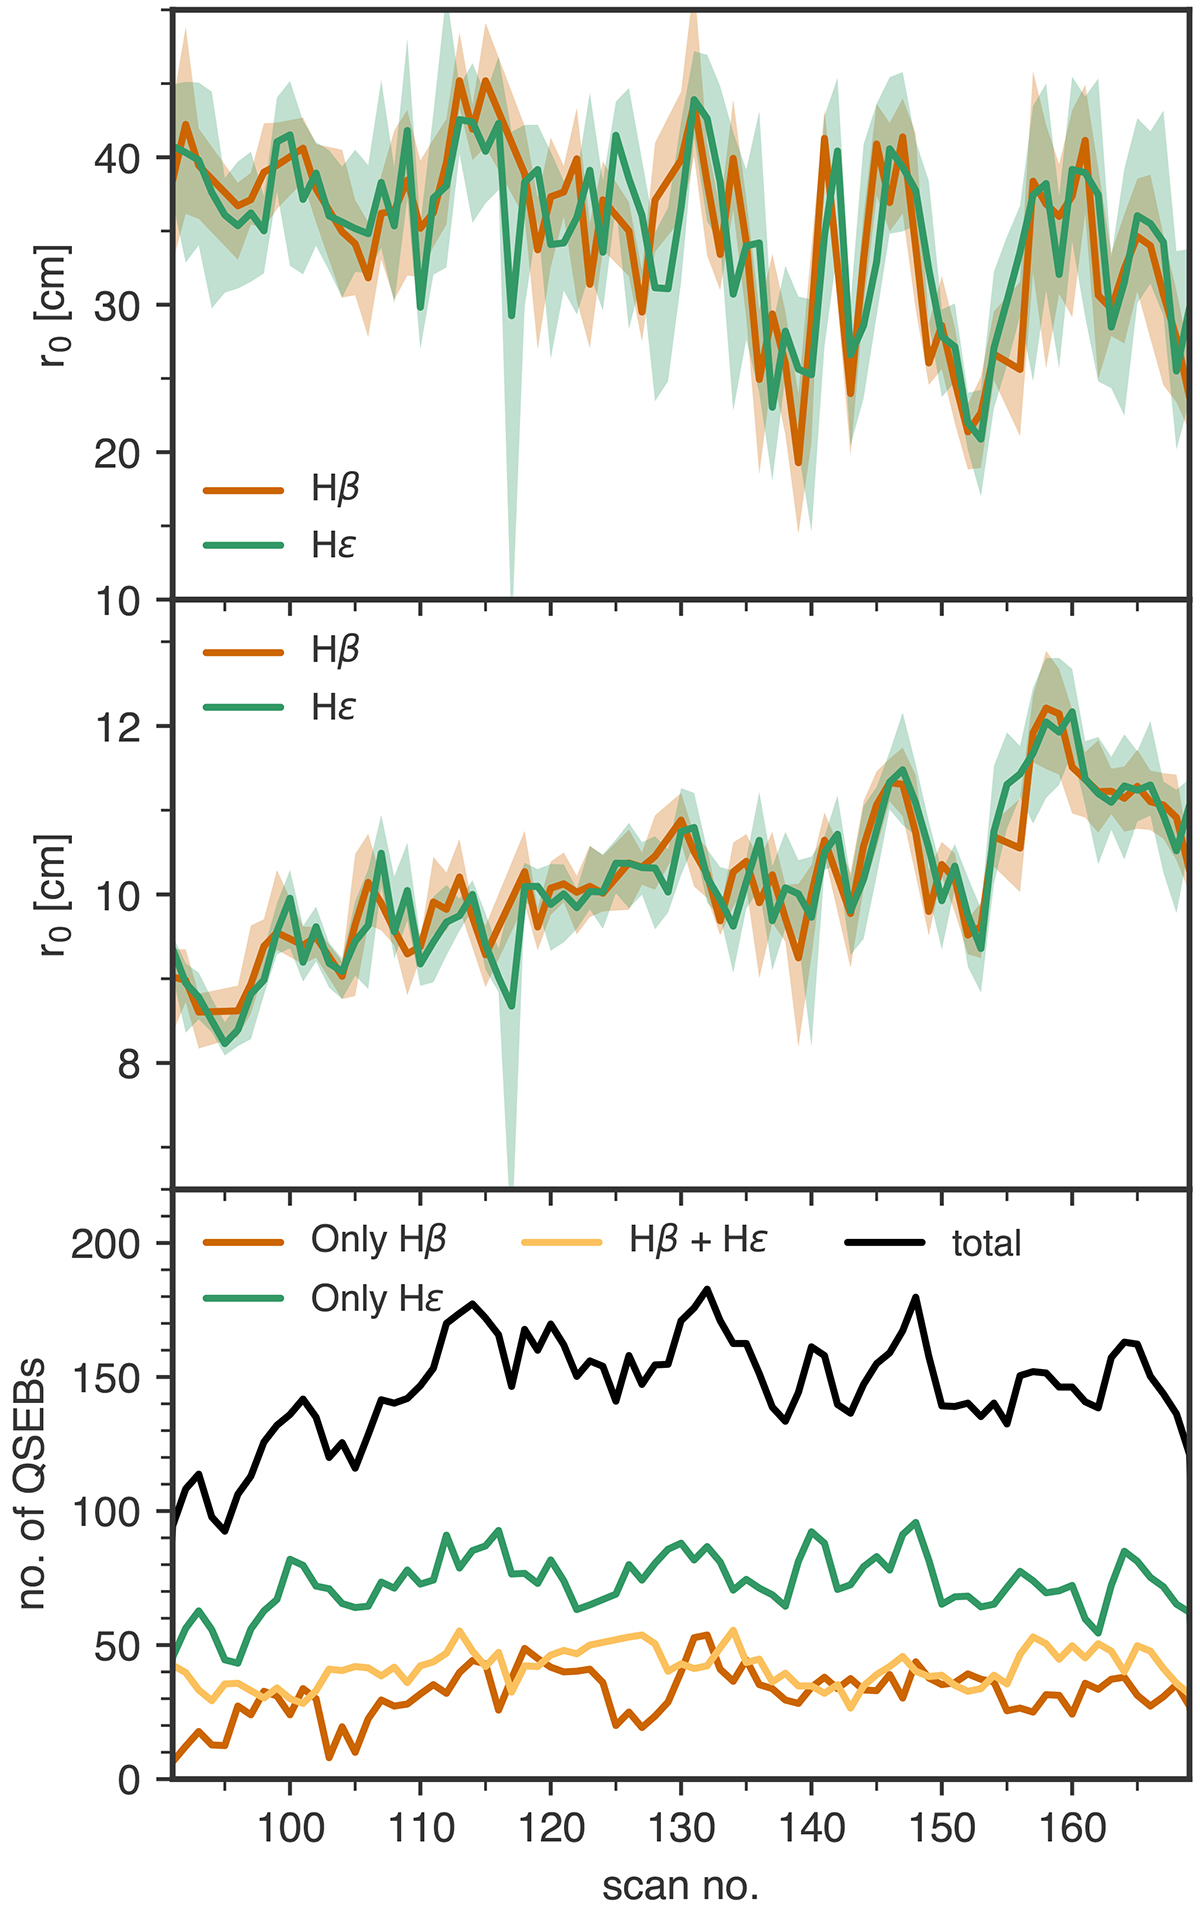
Impact of the seeing quality on the number of QSEB detections. The top two panels show the Fried parameter r0 as a function of time (indicated as the scan number in the 24 min time series, which started at 90). The top panel shows r0 values that are a measure of the ground-layer seeing alone. The middle panel shows r0 values that measure the seeing over the whole atmosphere. The Hβ and Hε lines were recorded sequentially, so there are two separate curves for the two spectral lines. The solid curves show the average r0 values during the scan, and the shaded area shows the range of r0 values during the spectral scan. The bottom panel shows the number of QSEB detections per scan differentiated by QSEBs detected in Hβ alone, in Hε alone, or in both Hβ and Hε. The black curve shows the total number of QSEB detections as the sum of these three curves.
Current usage metrics show cumulative count of Article Views (full-text article views including HTML views, PDF and ePub downloads, according to the available data) and Abstracts Views on Vision4Press platform.
Data correspond to usage on the plateform after 2015. The current usage metrics is available 48-96 hours after online publication and is updated daily on week days.
Initial download of the metrics may take a while.