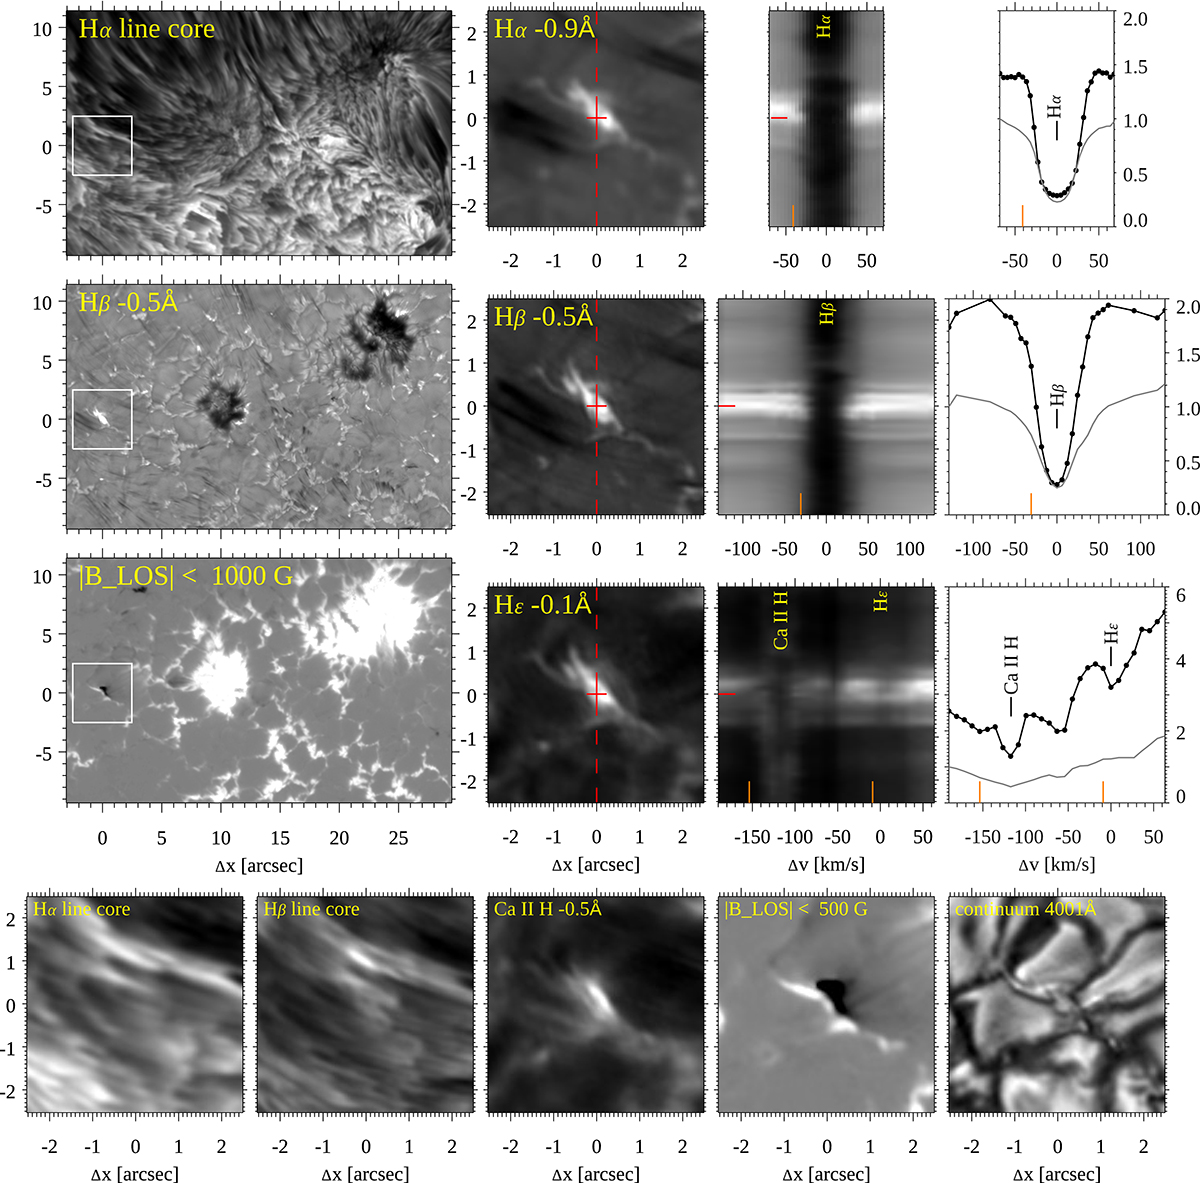
Fig. 1.
Download original image
Strong EB in an active region observed on 11 August 2020. The larger rectangular panels left in the top three rows show the larger context area in the Hα line core, the Hβ blue wing, and a magnetogram. The white square is centered on the EB and marks the area that is shown at larger magnification in the other square images. The dashed red line in the Balmer blue-wing images (Hα, Hβ, Hε) marks the artificial slit for which the corresponding spectrogram (λy diagram) is shown to the right. The EB spectral profiles, marked by horizontal red dashes, are shown in the right panels as solid black lines with the observed sampling points marked as small filled circles. The thin gray profiles are reference spectral profiles averaged over the full region shown in the left context images. The vertical orange dashes mark the wavelength positions of the Balmer-wing images and the Ca II H blue-wing image in the bottom row. Two animations are available online: one showing the temporal evolution of the middle rows of this figure, and one showing spectral line scans of the top three rows.
Current usage metrics show cumulative count of Article Views (full-text article views including HTML views, PDF and ePub downloads, according to the available data) and Abstracts Views on Vision4Press platform.
Data correspond to usage on the plateform after 2015. The current usage metrics is available 48-96 hours after online publication and is updated daily on week days.
Initial download of the metrics may take a while.