Open Access
Fig. A.3.
Download original image
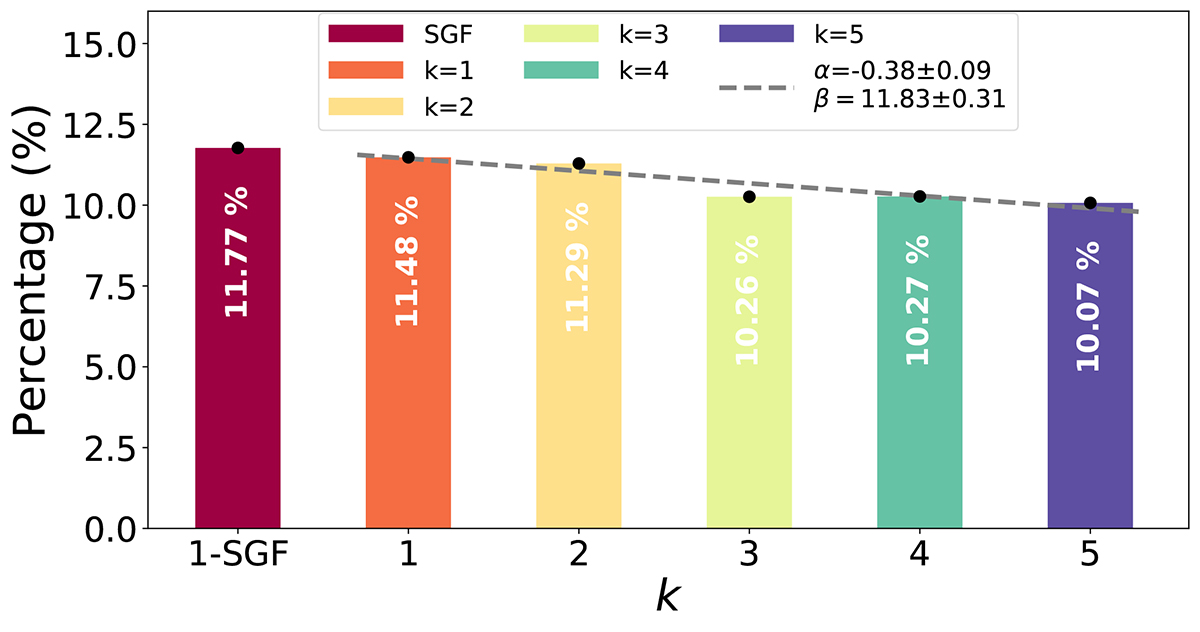
Percentage of BBH mergers over all the simulated encounters in NSCs, where bmax was computed with eq. 12 and eq. A.1, assuming k = 1, 2, 3, 4, 5. The bar colours are the same as in Figs. A.1 and A.2. The dashed grey line is the linear fit to the percentage of mergers as a function of the k parameter.
Current usage metrics show cumulative count of Article Views (full-text article views including HTML views, PDF and ePub downloads, according to the available data) and Abstracts Views on Vision4Press platform.
Data correspond to usage on the plateform after 2015. The current usage metrics is available 48-96 hours after online publication and is updated daily on week days.
Initial download of the metrics may take a while.