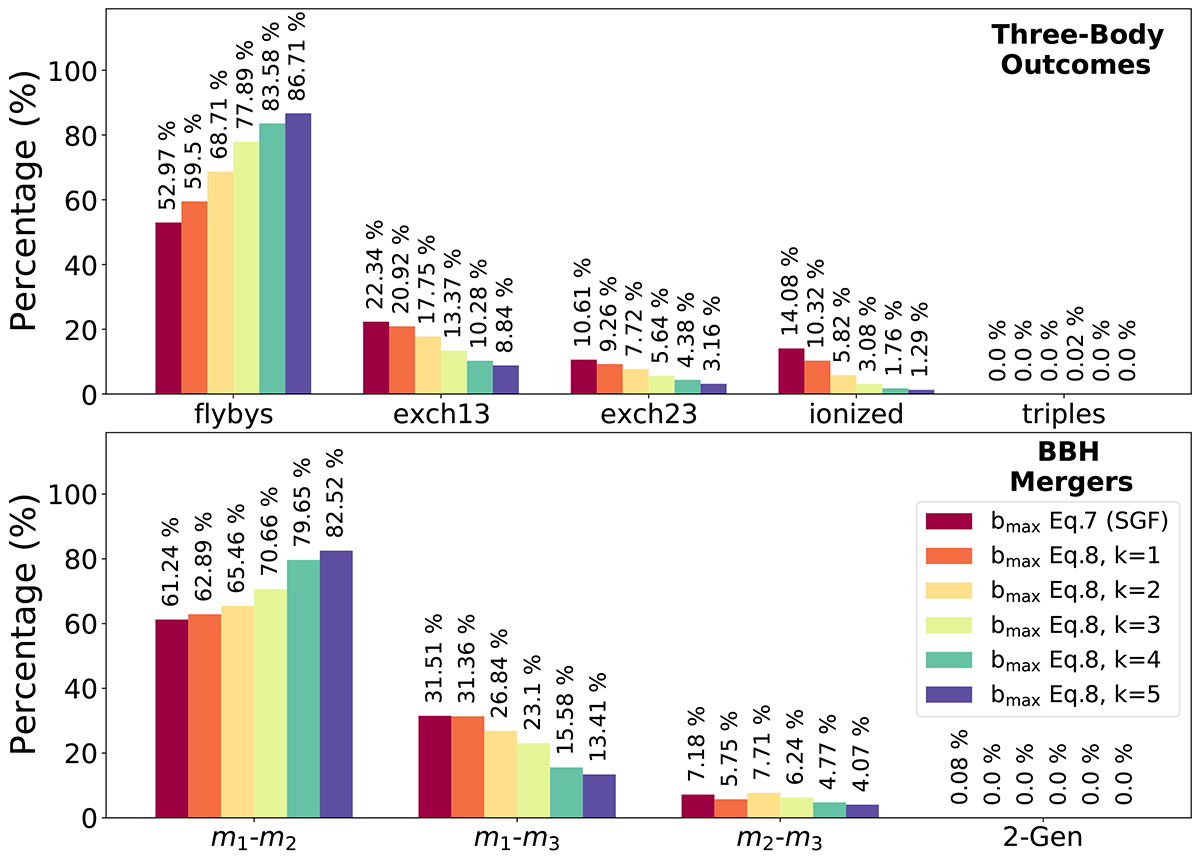
Fig. A.2.
Download original image
Same as Fig. 2 but assuming eq. A.1 for the choice of bmax. The plot shows the outcome of the three-body simulations (upper panel) and the formation channel of the BBH mergers (lower panel) for the main NSC set initialised with eq. 12 (dark red, fiducial model) and the smaller NSC sets initialised with eq. A.1 assuming k = 1 (orange), 2 (yellow), 3 (light green), 4 (dark green), and 5 (blue).
Current usage metrics show cumulative count of Article Views (full-text article views including HTML views, PDF and ePub downloads, according to the available data) and Abstracts Views on Vision4Press platform.
Data correspond to usage on the plateform after 2015. The current usage metrics is available 48-96 hours after online publication and is updated daily on week days.
Initial download of the metrics may take a while.