Fig. 3
Download original image
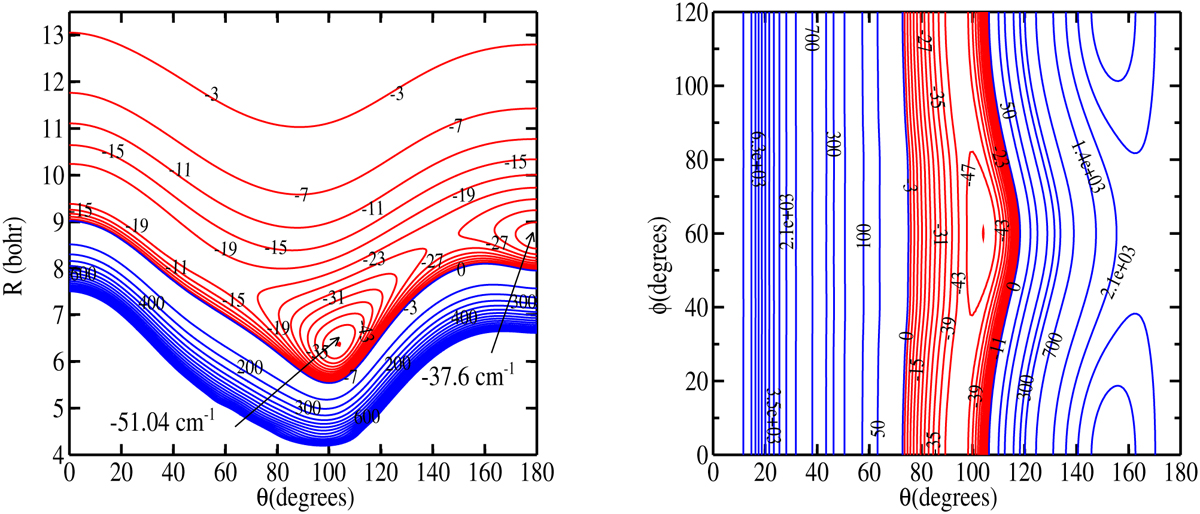
2D contour plots of the interaction potential of the CH3CCH-He van der Waals complex. The left panel depicts the 3D PES as a function of θ and R at ϕ = 60°, while the right panel shows the PES as a function of ϕ and θ at R = 6.6a0. For each panel, the blue (red) contours represent the positive (negative) parts of the potential (in unit of cm−1).
Current usage metrics show cumulative count of Article Views (full-text article views including HTML views, PDF and ePub downloads, according to the available data) and Abstracts Views on Vision4Press platform.
Data correspond to usage on the plateform after 2015. The current usage metrics is available 48-96 hours after online publication and is updated daily on week days.
Initial download of the metrics may take a while.