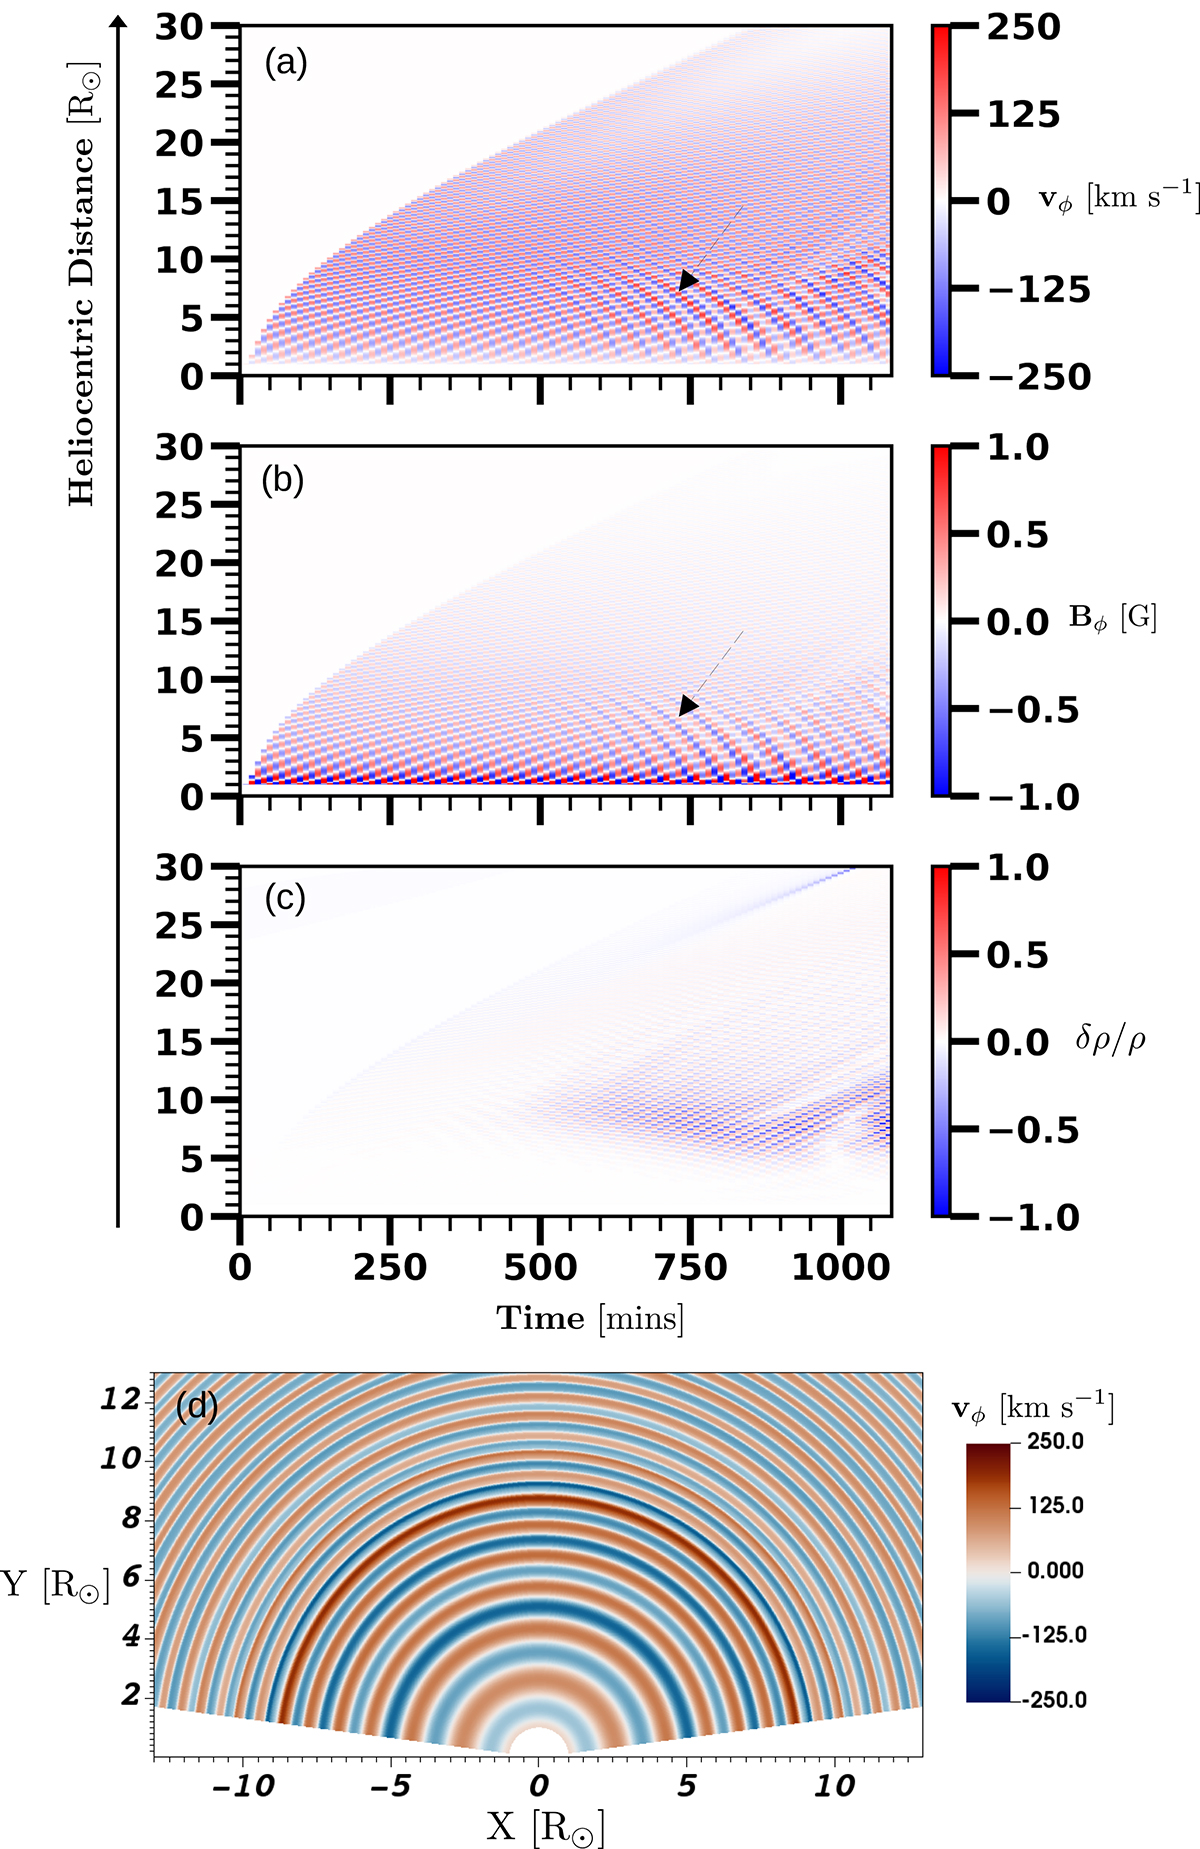
Fig. 2.
Download original image
Evolution of the solar wind as the Alfvén waves propagate through the corona. The fluctuating velocity and magnetic field components are shown in panels a and b. The density perturbations defined as δρ/ρ, where δρ = ρ − ⟨ρ⟩ and ⟨ρ⟩ is the density averaged over 10 min intervals, are shown in panel c. Panel d is a simulation snapshot of vϕ at τ = 1000 min. The dashed arrows in panels a and b highlight the apparent bifurcation of vϕ and Bϕ.
Current usage metrics show cumulative count of Article Views (full-text article views including HTML views, PDF and ePub downloads, according to the available data) and Abstracts Views on Vision4Press platform.
Data correspond to usage on the plateform after 2015. The current usage metrics is available 48-96 hours after online publication and is updated daily on week days.
Initial download of the metrics may take a while.