Fig. 4.
Download original image
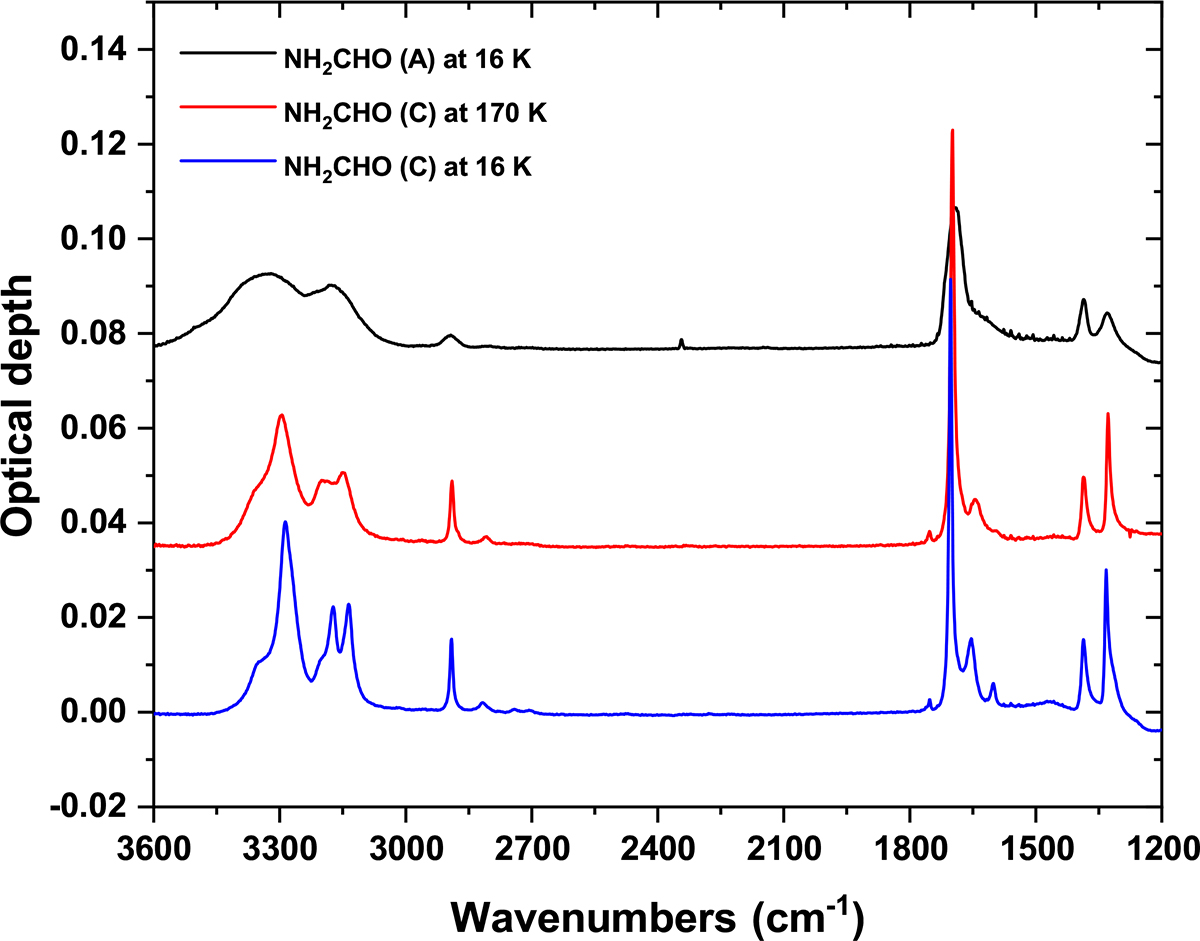
Comparison of mid-IR spectra for a 23.4 ML NH2CHO film deposited on a CsI substrate under different temperature conditions. The top curve in black represents the spectrum at 16 K immediately after deposition. The middle curve in red corresponds to the spectrum after heating the sample to 170 K, and the bottom curve in blue represents the spectrum upon cooling back to 16 K. The ice upon warming up crystallises and shows sharp features that are irreversible even after cooling back to 16 K. For clarity in visualisation, the black, red, and blue curves have been offset along the vertical axis by 0.04, 0.04, and −0.04 units, respectively. It is worth noting that the crystalline phase of ice is indicated as “C” in the spectra.
Current usage metrics show cumulative count of Article Views (full-text article views including HTML views, PDF and ePub downloads, according to the available data) and Abstracts Views on Vision4Press platform.
Data correspond to usage on the plateform after 2015. The current usage metrics is available 48-96 hours after online publication and is updated daily on week days.
Initial download of the metrics may take a while.