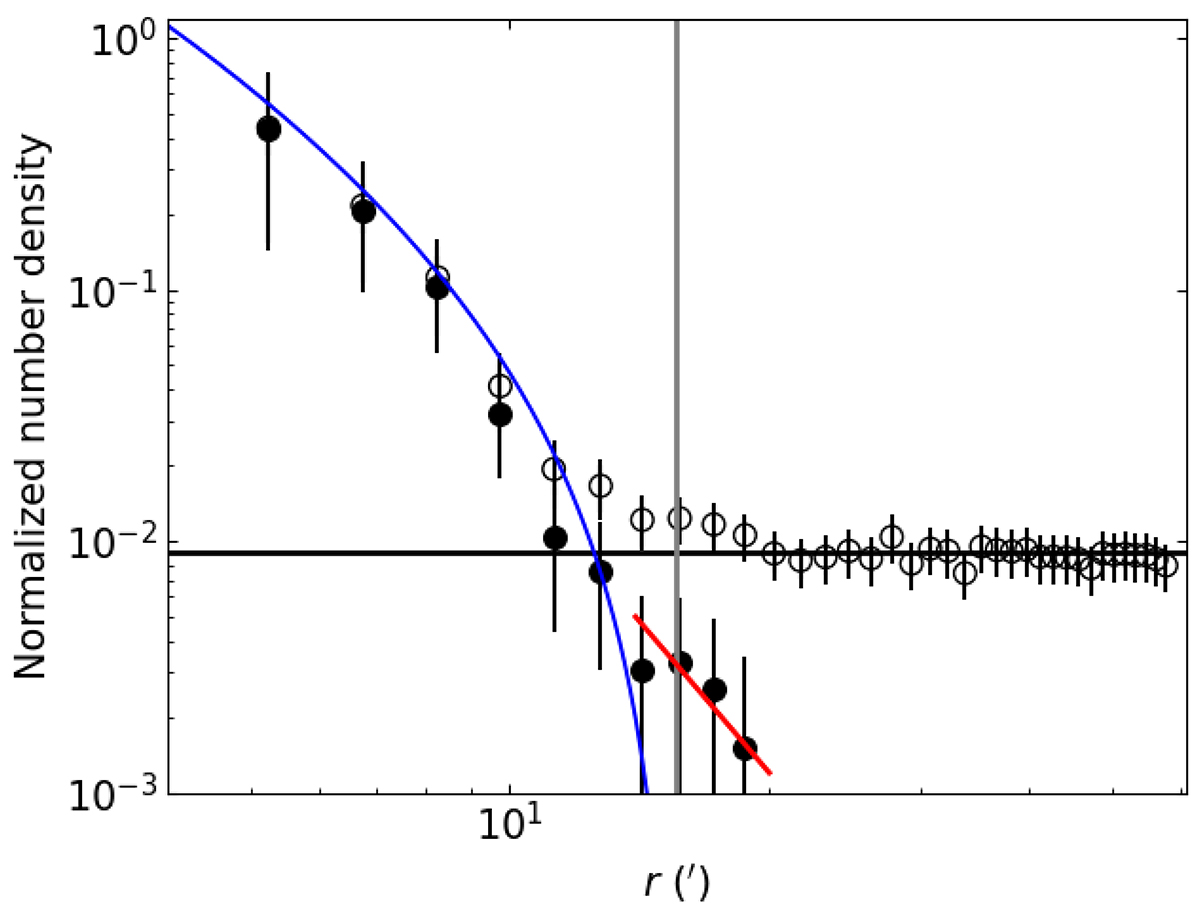
Fig. 9.
Download original image
Observed and background-corrected normalized stellar density profiles represented by open and filled circles, respectively. Error bars are also shown. The blue curve represents the King’s model for the core and tidal radius of the cluster (Baumgardt & Hilker 2018), while the red line corresponds to a power law with a slope equal to 4.0. Black horizontal and gray vertical lines represent the mean background level and the cluster’s Jacobi radius, respectively.
Current usage metrics show cumulative count of Article Views (full-text article views including HTML views, PDF and ePub downloads, according to the available data) and Abstracts Views on Vision4Press platform.
Data correspond to usage on the plateform after 2015. The current usage metrics is available 48-96 hours after online publication and is updated daily on week days.
Initial download of the metrics may take a while.