Fig. 5.
Download original image
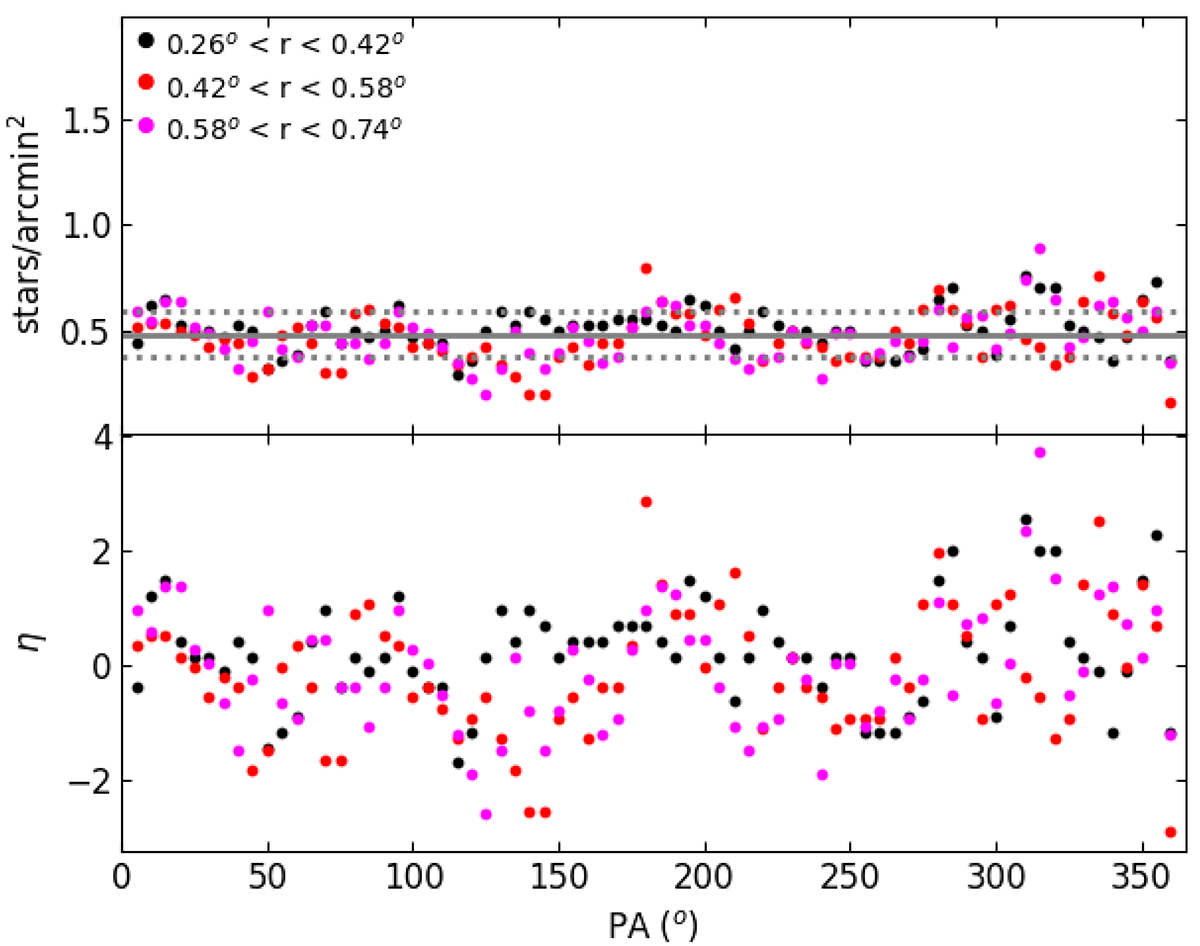
Stellar density as a function of the position angle for three different concentric annuli centered on NGC 6362, as indicated in the top panel. The solid and dotted lines represent the mean and standard deviation of all the plotted points. The significance (η) of the stellar density over the mean background value is depicted in the bottom panel.
Current usage metrics show cumulative count of Article Views (full-text article views including HTML views, PDF and ePub downloads, according to the available data) and Abstracts Views on Vision4Press platform.
Data correspond to usage on the plateform after 2015. The current usage metrics is available 48-96 hours after online publication and is updated daily on week days.
Initial download of the metrics may take a while.