Open Access
Fig. 4.
Download original image
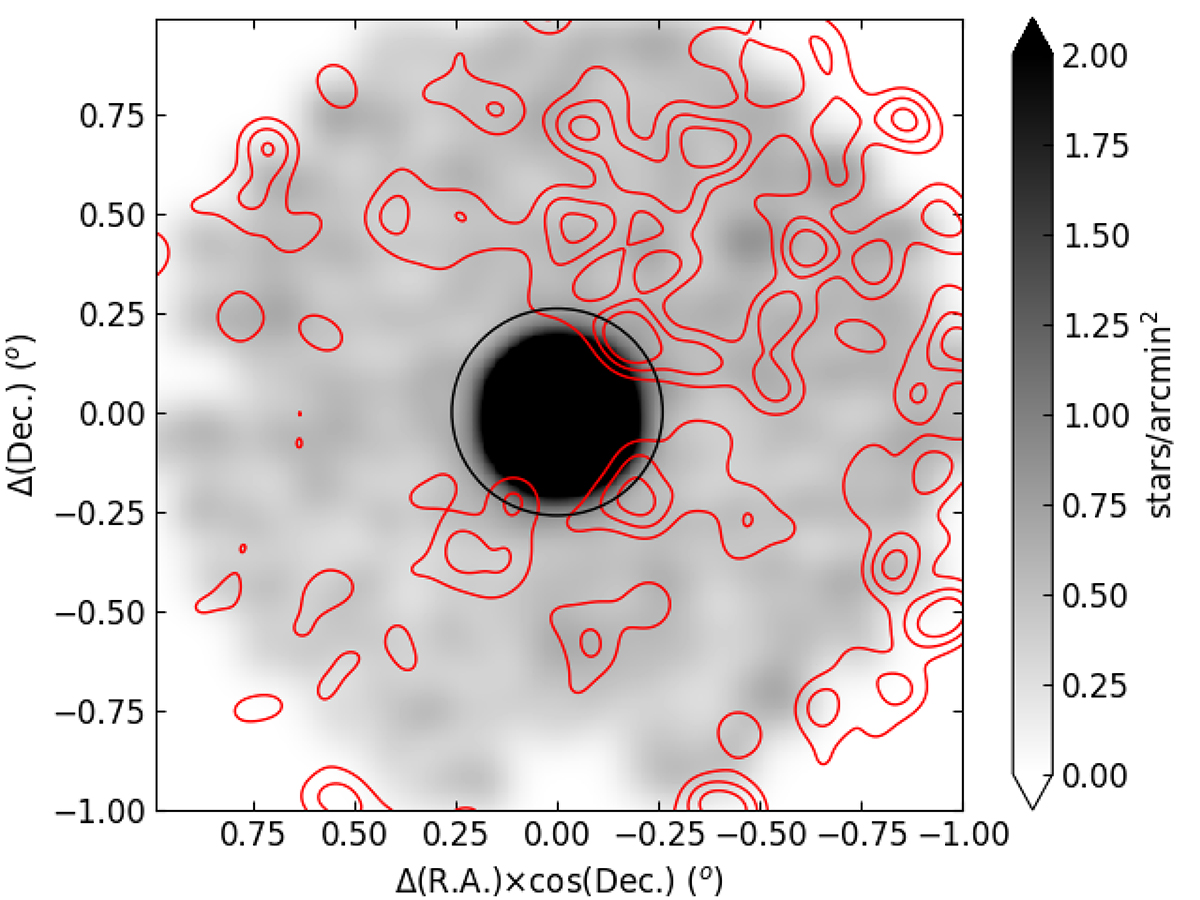
Stellar density map of stars distributed within the cluster’s main sequence region. The black circle represents the cluster’s Jacobi radius, while the red contours correspond to the stellar density levels of the stars selected by Kundu et al. (2019) (see Fig. 6).
Current usage metrics show cumulative count of Article Views (full-text article views including HTML views, PDF and ePub downloads, according to the available data) and Abstracts Views on Vision4Press platform.
Data correspond to usage on the plateform after 2015. The current usage metrics is available 48-96 hours after online publication and is updated daily on week days.
Initial download of the metrics may take a while.