Fig. 5.
Download original image
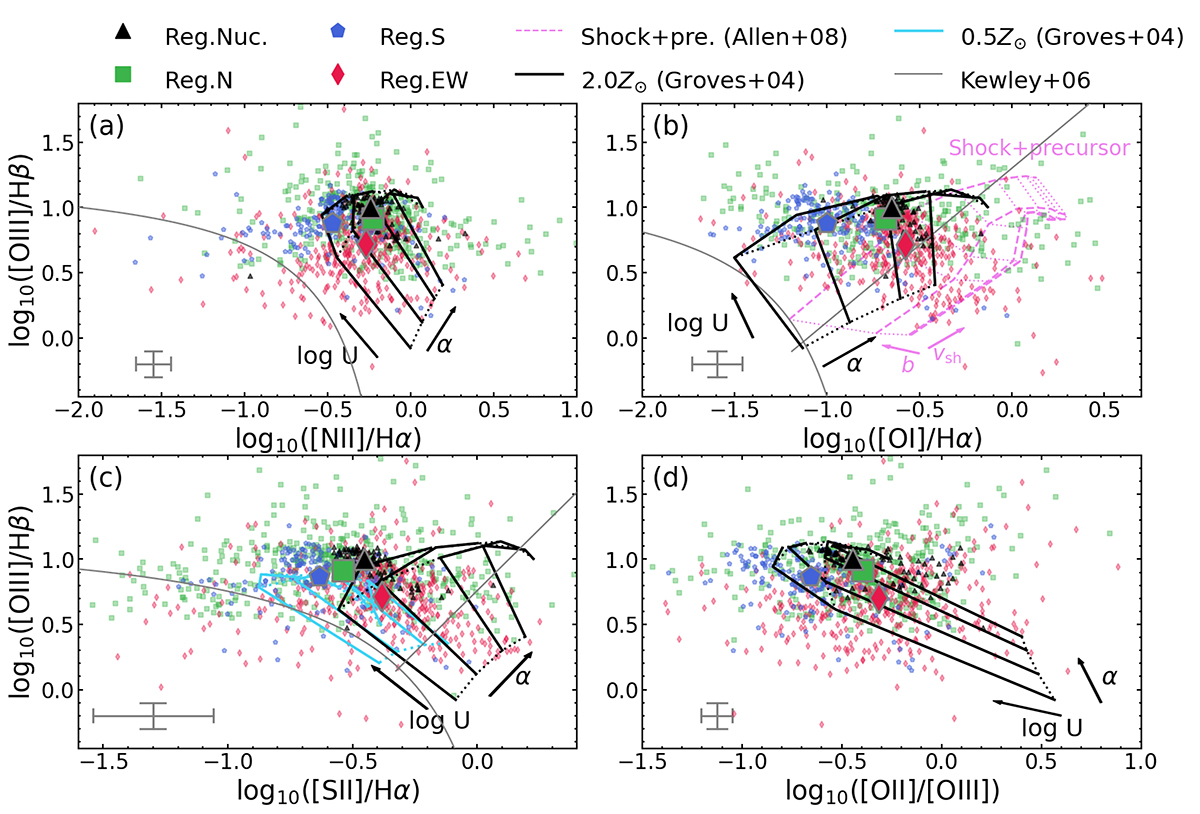
Line ratio diagnostic diagrams based on fitting and corrected for dust attenuation. Each smaller mark corresponds to one spaxel in the FoV. The larger symbols represent the median. Data points with the same symbol are the same region marked as Fig. 4: Nuc. – nucleus (circle with r = 0.25″), N – north, S – south, EW – east+west. The typical 1σ error is shown at the left corner. We show the 2 Z⊙ dusty radiation-pressure dominated photonionization models from Groves et al. (2004a) in black and mark the direction of increasing ionization parameter, log U ∈ [ − 3.0, −2.0, −1.0, 0.0], and power-law index, α ∈ [ − 2.0, −1.7, −1.4, −1.2]. The similar model with 0.5 Z⊙ is shown in panel c in cyan. Purple grids are the “shock+precursor” models with per-shock density 100 cm−3, (shock velocities of 200 ≤ vshock ≤ 1000 km s−1 in steps of 100 km s−1 and magnetic parameters of 0.01 ≤ b = B/n1/2 ≤ 100 μG cm−3/2 in steps of 1 dex, Allen et al. 2008). The directions of increasing vshock and b are indicated with purple arrows. We include the empirical classification from Kewley et al. (2006) in gray lines in panels a–c.
Current usage metrics show cumulative count of Article Views (full-text article views including HTML views, PDF and ePub downloads, according to the available data) and Abstracts Views on Vision4Press platform.
Data correspond to usage on the plateform after 2015. The current usage metrics is available 48-96 hours after online publication and is updated daily on week days.
Initial download of the metrics may take a while.