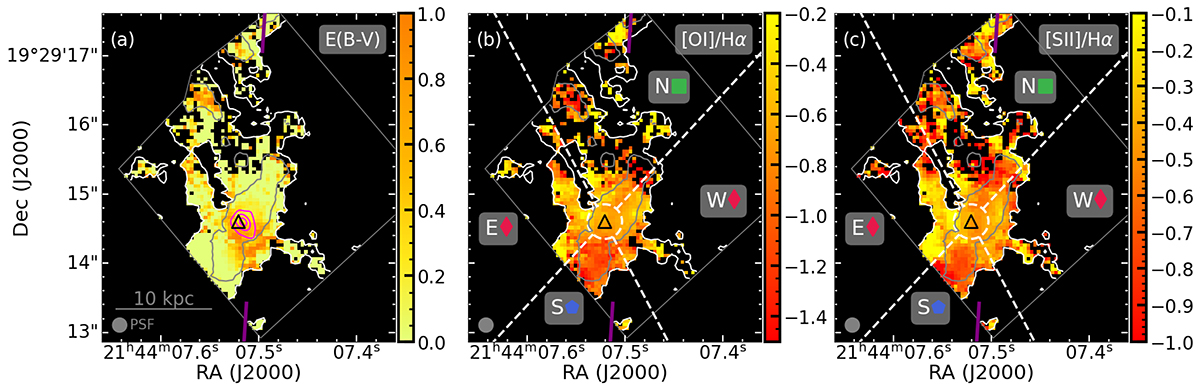
Fig. 4.
Download original image
Dust attenuation (a) and line ratio maps (b), (c) constructed based on the fit fluxes integrated for all components. The white and gray contours indicate the 5σ and 15σ [O III] surface brightness levels of the un-smoothed systemic narrowband image, respectively (Fig. 1). Dark purple lines show the directions toward the radio jet hot spots. Black triangle marks the position of the AGN while magenta contours trace the ALMA continuum (Fig. 1d). The dashed white lines and circle in panel b and c divide the FoV into five regions for line ratio diagnostic analysis (Fig. 5). FWHM of the JWST PSF is marked at the left corner.
Current usage metrics show cumulative count of Article Views (full-text article views including HTML views, PDF and ePub downloads, according to the available data) and Abstracts Views on Vision4Press platform.
Data correspond to usage on the plateform after 2015. The current usage metrics is available 48-96 hours after online publication and is updated daily on week days.
Initial download of the metrics may take a while.