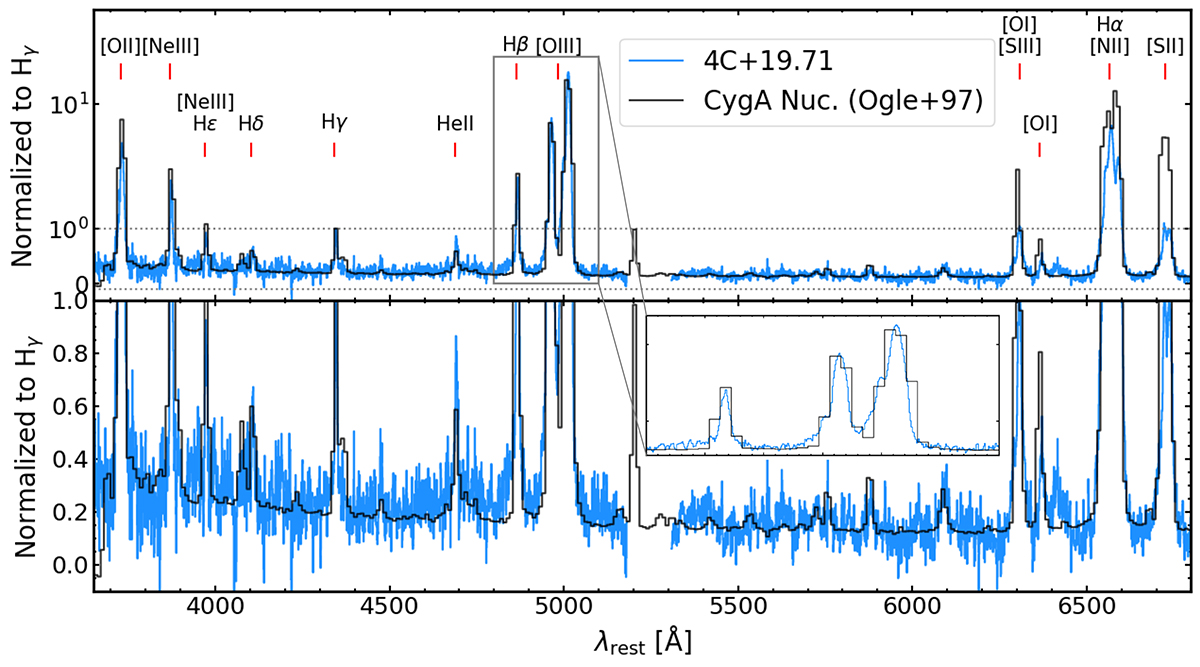
Fig. 3.
Download original image
Spectral comparison of 4C+19.71 to Cygnus A (Ogle et al. 1997). Blue histogram shows the same 1D spectrum as in Fig. 2. The spectrum of Cygnus A is shown in black which is extracted at its nucleus position after Galactic reddening correction and subtraction of a elliptical galaxy template. Both spectra are normalized to the peak flux density of their Hγ. The bottom panel is a zoom-in version of the region between the gray dotted lines in the upper panel. We marked the emission lines detected for 4C+19.71 with S/N ≳ 10 as in Fig. 2. The inset provides a further zoom-in around Hβ–[O III] complex.
Current usage metrics show cumulative count of Article Views (full-text article views including HTML views, PDF and ePub downloads, according to the available data) and Abstracts Views on Vision4Press platform.
Data correspond to usage on the plateform after 2015. The current usage metrics is available 48-96 hours after online publication and is updated daily on week days.
Initial download of the metrics may take a while.