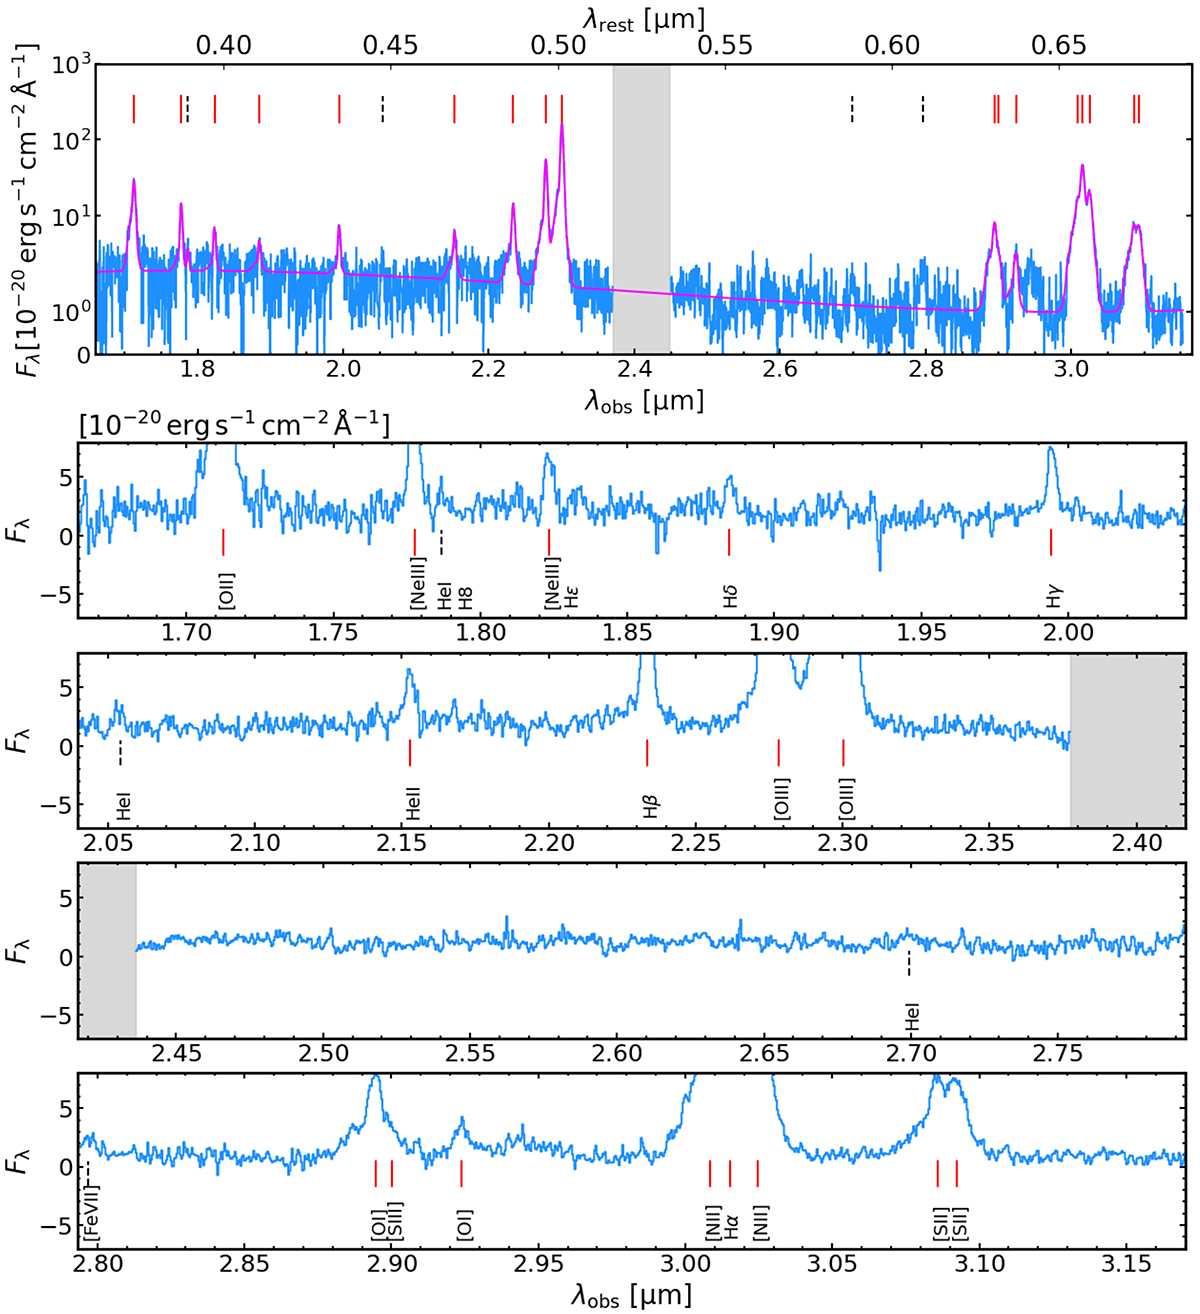
Fig. 2.
Download original image
Full spectrum extracted at the AGN position without continuum subtraction (black box in Fig. 1d). We mark the emission lines detected with S/N ≳ 10 in red lines. Lines detected with 3 < S/N < 10 and visually checked to be extended are marked with gray lines. We note that the feature at ∼2.945 μm is likely instrumental due to the leakage flux from the MSA. The central gray shaded region is the detector gap. The top panel is the full view of the spectrum while the zoom-in view of the faint lines are shown in the bottom panels. The magenta curves show the best fit of the spectrum (Appendix C).
Current usage metrics show cumulative count of Article Views (full-text article views including HTML views, PDF and ePub downloads, according to the available data) and Abstracts Views on Vision4Press platform.
Data correspond to usage on the plateform after 2015. The current usage metrics is available 48-96 hours after online publication and is updated daily on week days.
Initial download of the metrics may take a while.