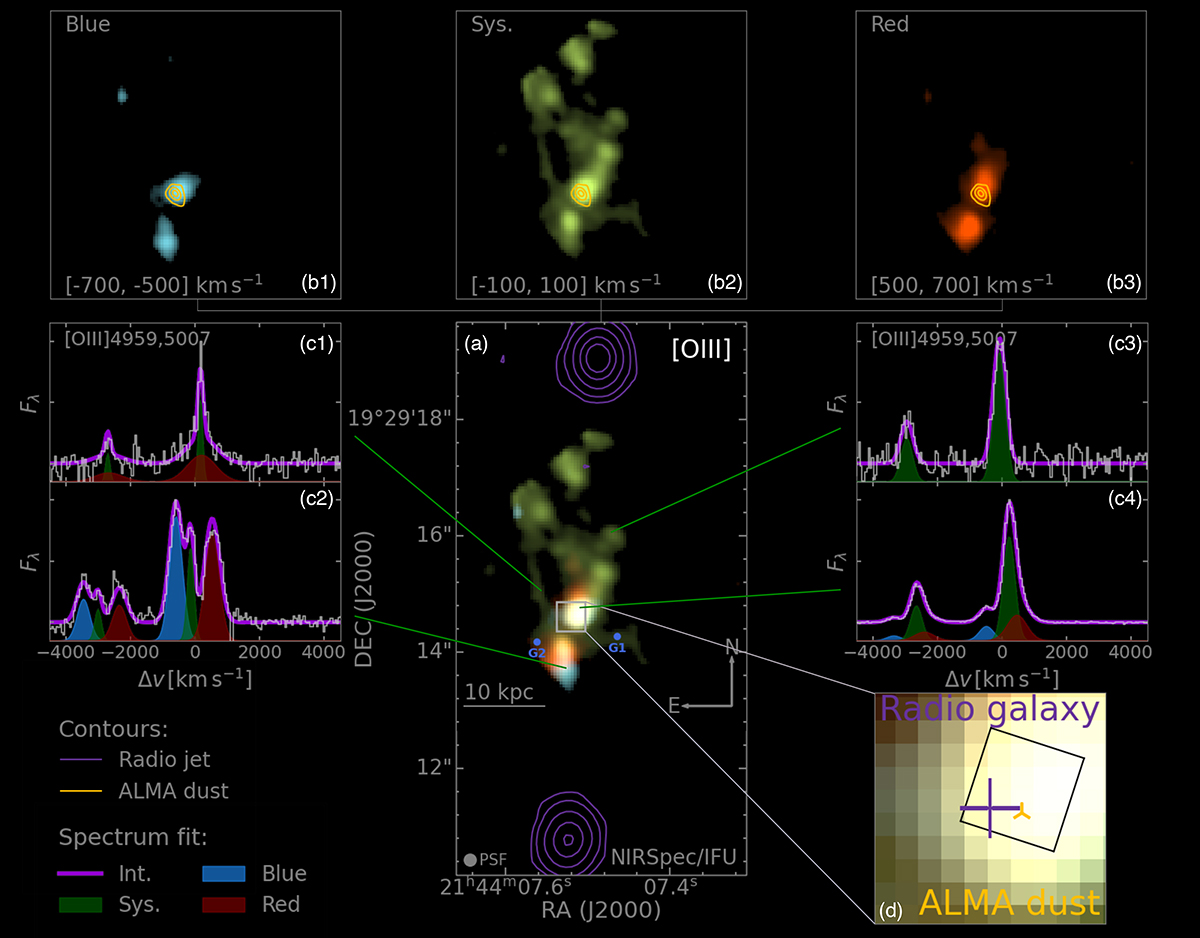
Fig. 1.
Download original image
NIRSpec [O III] color composite and example spectra of [O III] doublet. (a) Three-color composite image of narrowband [O III]5007. We overlay the VLA 4.7 GHz jet hot spots in dark purple contours. Blue dots indicate the position of foreground galaxies (see text). FWHM of the PSF is marked at the left corner. (b) “Monochrome” narrowband images of [O III]5007 collapsed at blue wing (b1), systemic redshift (b2), and red wing (b3), respectively. Yellow contours show dust continuum emission from the ALMA data. (c) Example spectra of continuum-subtracted [O III]4959, 5007 extracted at four different spatial locations normalized to their peak flux density. We fit the spectra using q3dfit with up to three kinematic components. The light purple curve indicates the overall fit. The individual components are shown in blue, green, and red with a negative offset from the zero level. (d) Zoom-in view of the central 0.5″ × 0.5″ region of the narrowband image (gray box in panel a). Dark purple plus + sign marks the position of the continuum emission of the radio galaxy determined from the NIRSpec cube while the yellow triple-spike triangle shows peak position of the ALMA 400.3 GHz dust. The sizes of the markers represent the position uncertainty, 1.2″ and 0.04″ for radio galaxy and ALMA dust respectively. Black box in the insert shows the aperture where the 1D spectrum (Fig. 2) is extracted.
Current usage metrics show cumulative count of Article Views (full-text article views including HTML views, PDF and ePub downloads, according to the available data) and Abstracts Views on Vision4Press platform.
Data correspond to usage on the plateform after 2015. The current usage metrics is available 48-96 hours after online publication and is updated daily on week days.
Initial download of the metrics may take a while.