Fig. 7.
Download original image
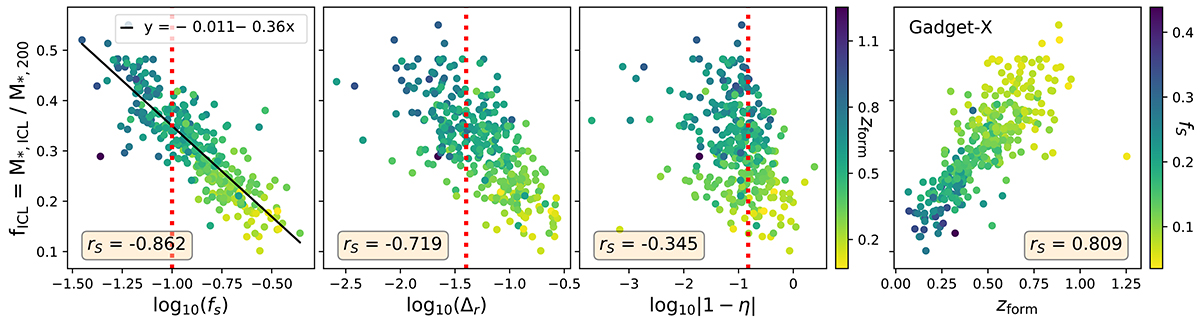
ICL mass fraction within R200 of the cluster as a function of the three different theoretical parameters introduced by Neto et al. (2007) to quantify the dynamical state (from left to right subhalo mass fraction fs, centre of mass offset Δr and virial ratio η), together with the formation time, zform. The first three panels are coloured by zform, while the fourth one is coloured by fs, as indicated in the colourbars. In all panels, the Spearman correlation coefficient, rS, is indicated in a lower corner. The vertical dashed lines indicate the thresholds used in Cui et al. (2018) to distinguish between “relaxed” and “unrelaxed” clusters: 0.1, 0.04 and 0.15, respectively. Clusters to the left of these lines (value lower than the threshold) are relaxed, and those to the right are unrelaxed.
Current usage metrics show cumulative count of Article Views (full-text article views including HTML views, PDF and ePub downloads, according to the available data) and Abstracts Views on Vision4Press platform.
Data correspond to usage on the plateform after 2015. The current usage metrics is available 48-96 hours after online publication and is updated daily on week days.
Initial download of the metrics may take a while.