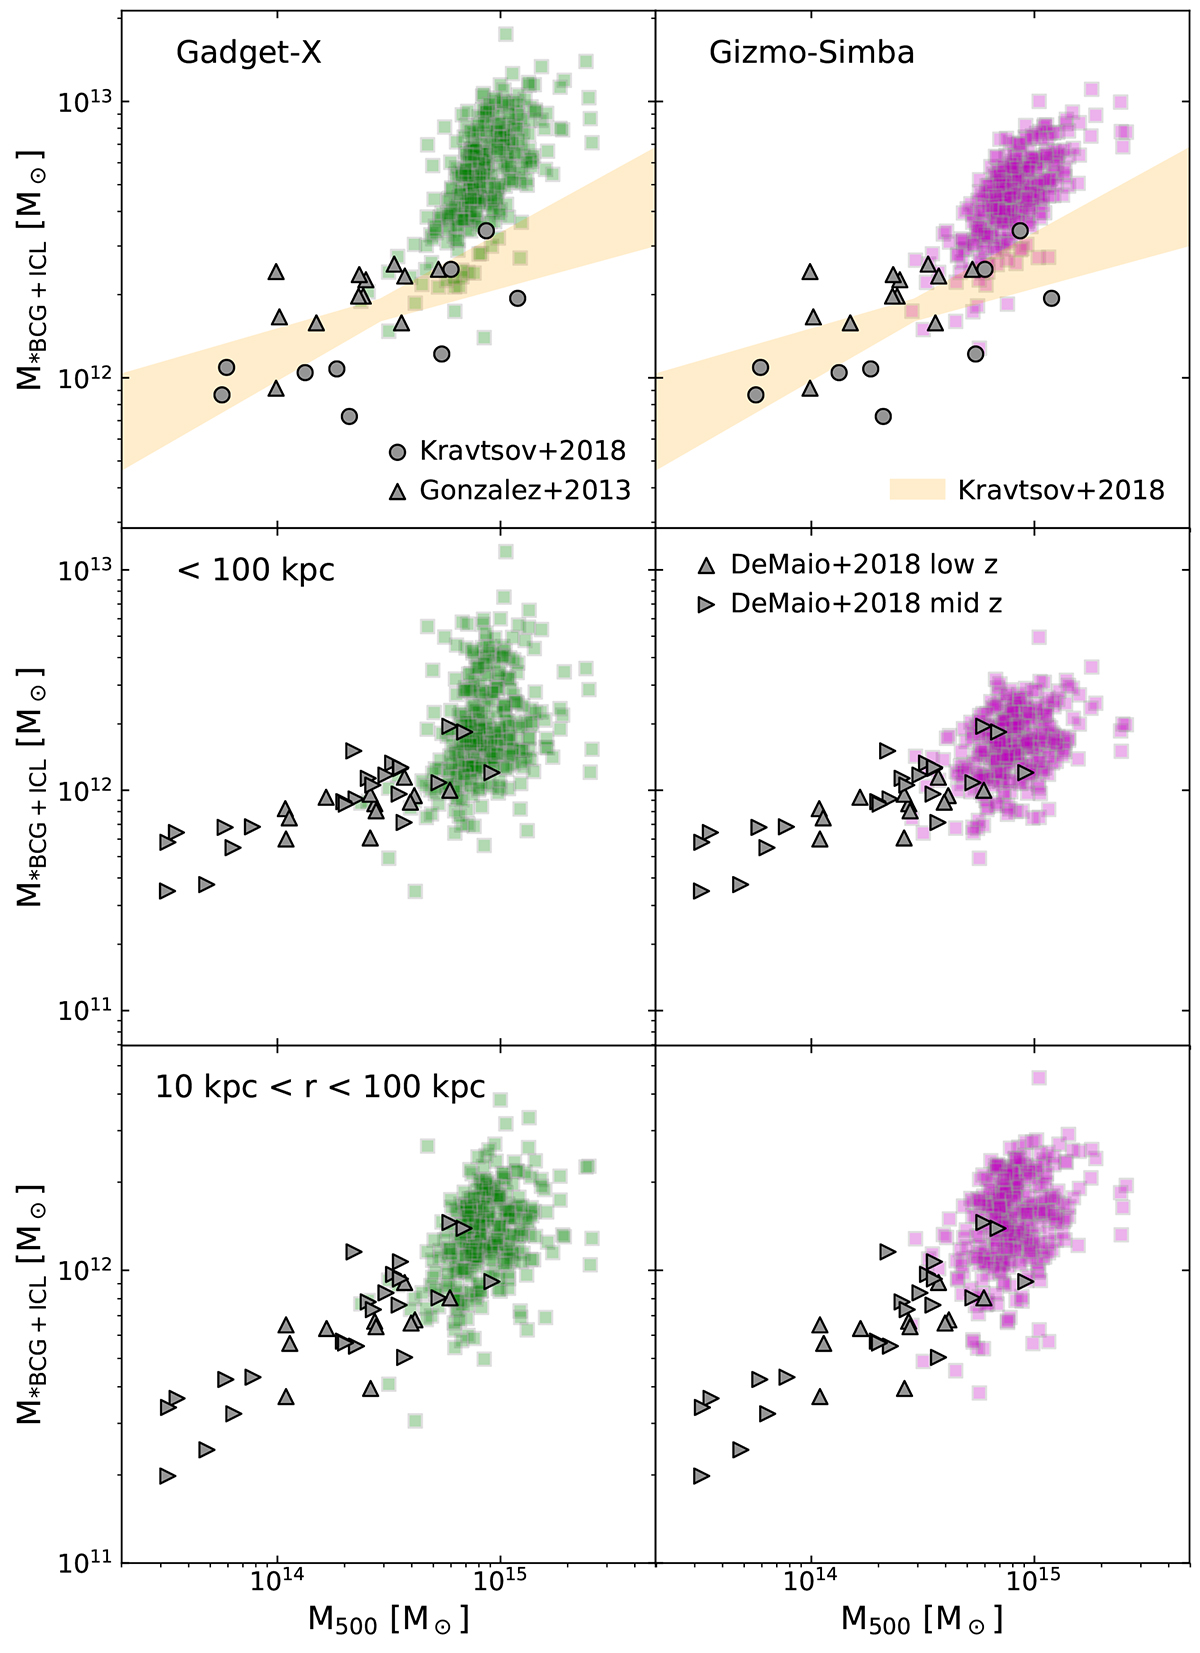
Fig. 3.
Download original image
GADGET-X (left) and GIZMO-SIMBA (right) BCG+ICL stellar mass within different spherical regions as a function of total halo mass. First row shows the total BCG+ICL stellar mass, squares denote individual measuremente of each of the 324 main clusters, grey symbols show data from Gonzalez et al. (2013) and Kravtsov et al. (2018), as labelled; the shaded region shows the best-fit from Kravtsov et al. (2018). Second row shows the total BCG+ICL mass within 100 kpc aperture and the third one shows the BCG+ICL stellar mass contained between 10 and 100 kpc apertures. Grey symbols show observational estimations from DeMaio et al. (2020).
Current usage metrics show cumulative count of Article Views (full-text article views including HTML views, PDF and ePub downloads, according to the available data) and Abstracts Views on Vision4Press platform.
Data correspond to usage on the plateform after 2015. The current usage metrics is available 48-96 hours after online publication and is updated daily on week days.
Initial download of the metrics may take a while.