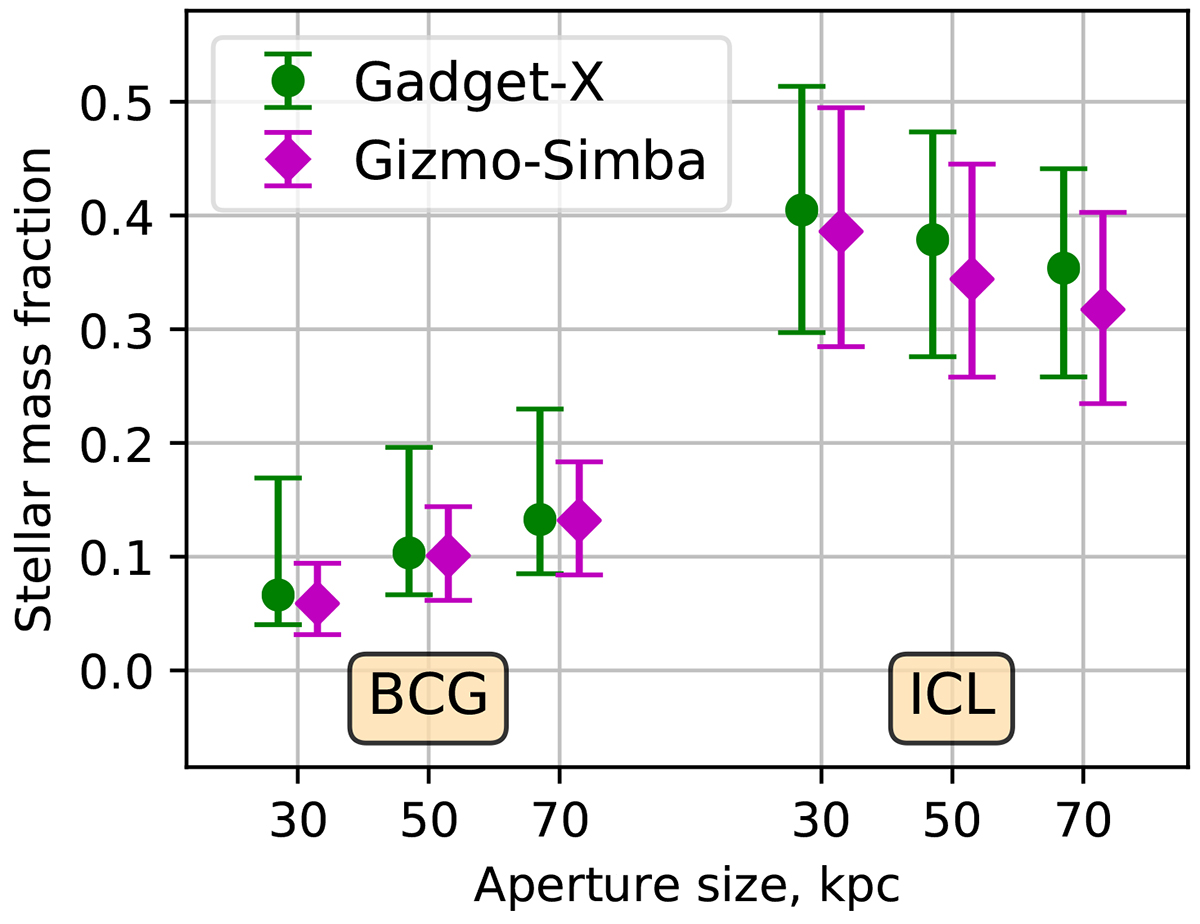
Fig. A.2.
Download original image
Stellar mass fraction for the BCG and ICL comparing the aperture size used to define the BCG. This is computed dividing the stellar mass content in each of the components by the total stellar mass inside R500, M*, 500. The dots show the median value for the 324 clusters, while the error bars indicate 16th-84th percentiles. Green circles are for GADGET-X, magenta diamonds for GIZMO-SIMBA.
Current usage metrics show cumulative count of Article Views (full-text article views including HTML views, PDF and ePub downloads, according to the available data) and Abstracts Views on Vision4Press platform.
Data correspond to usage on the plateform after 2015. The current usage metrics is available 48-96 hours after online publication and is updated daily on week days.
Initial download of the metrics may take a while.