Fig. 10.
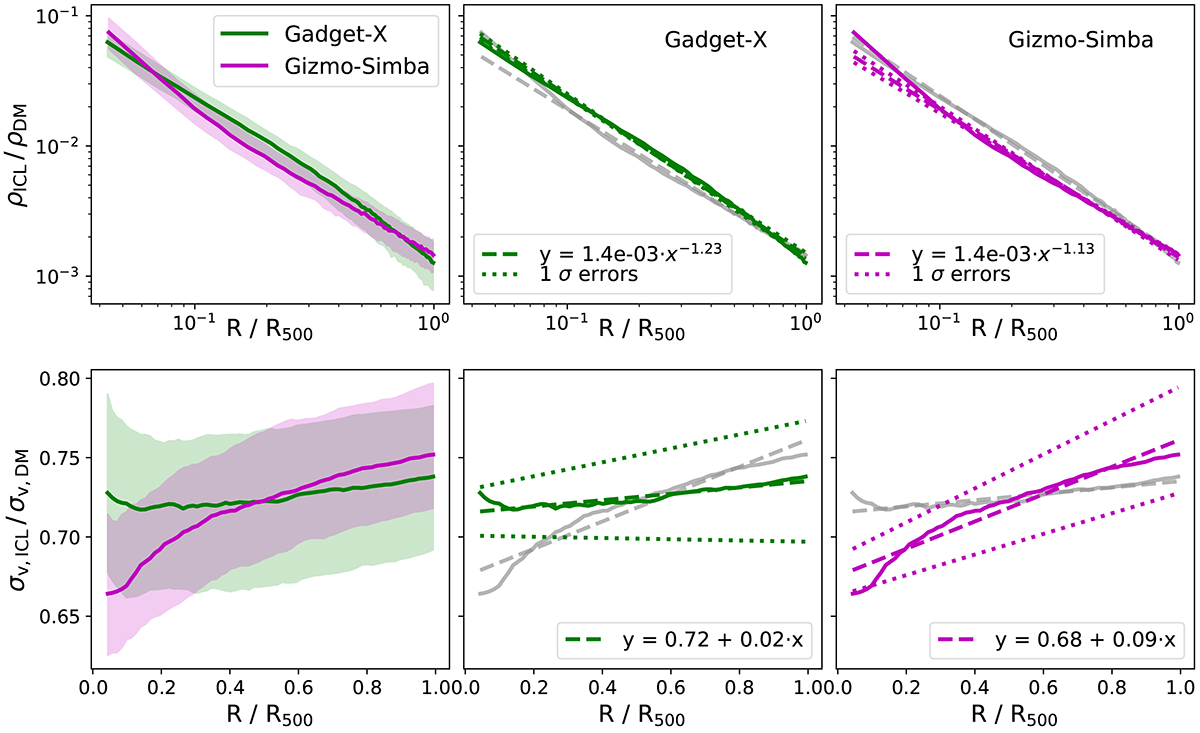
Download original image
Relation between ICL and DM radial profiles. Top: ratio between the ICL and DM density profiles. In the left panel, solid lines are the median values, green for GADGET-X and magenta for GIZMO-SIMBA, while the shaded regions are the 16th–84th percentiles. The middle and right panels show the best fit to an exponential curve of the GADGET-X and GIZMO-SIMBA ratios, respectively (the fainter grey lines are for the opposite simulation, for easier comparison between them). The dashed lines depict the best fit (the analytical formula can be seen in the legend), while the dotted lines indicate the 1σ errors. Bottom: same as the top row but for the ratio between ICL and DM velocity dispersion profiles.
Current usage metrics show cumulative count of Article Views (full-text article views including HTML views, PDF and ePub downloads, according to the available data) and Abstracts Views on Vision4Press platform.
Data correspond to usage on the plateform after 2015. The current usage metrics is available 48-96 hours after online publication and is updated daily on week days.
Initial download of the metrics may take a while.