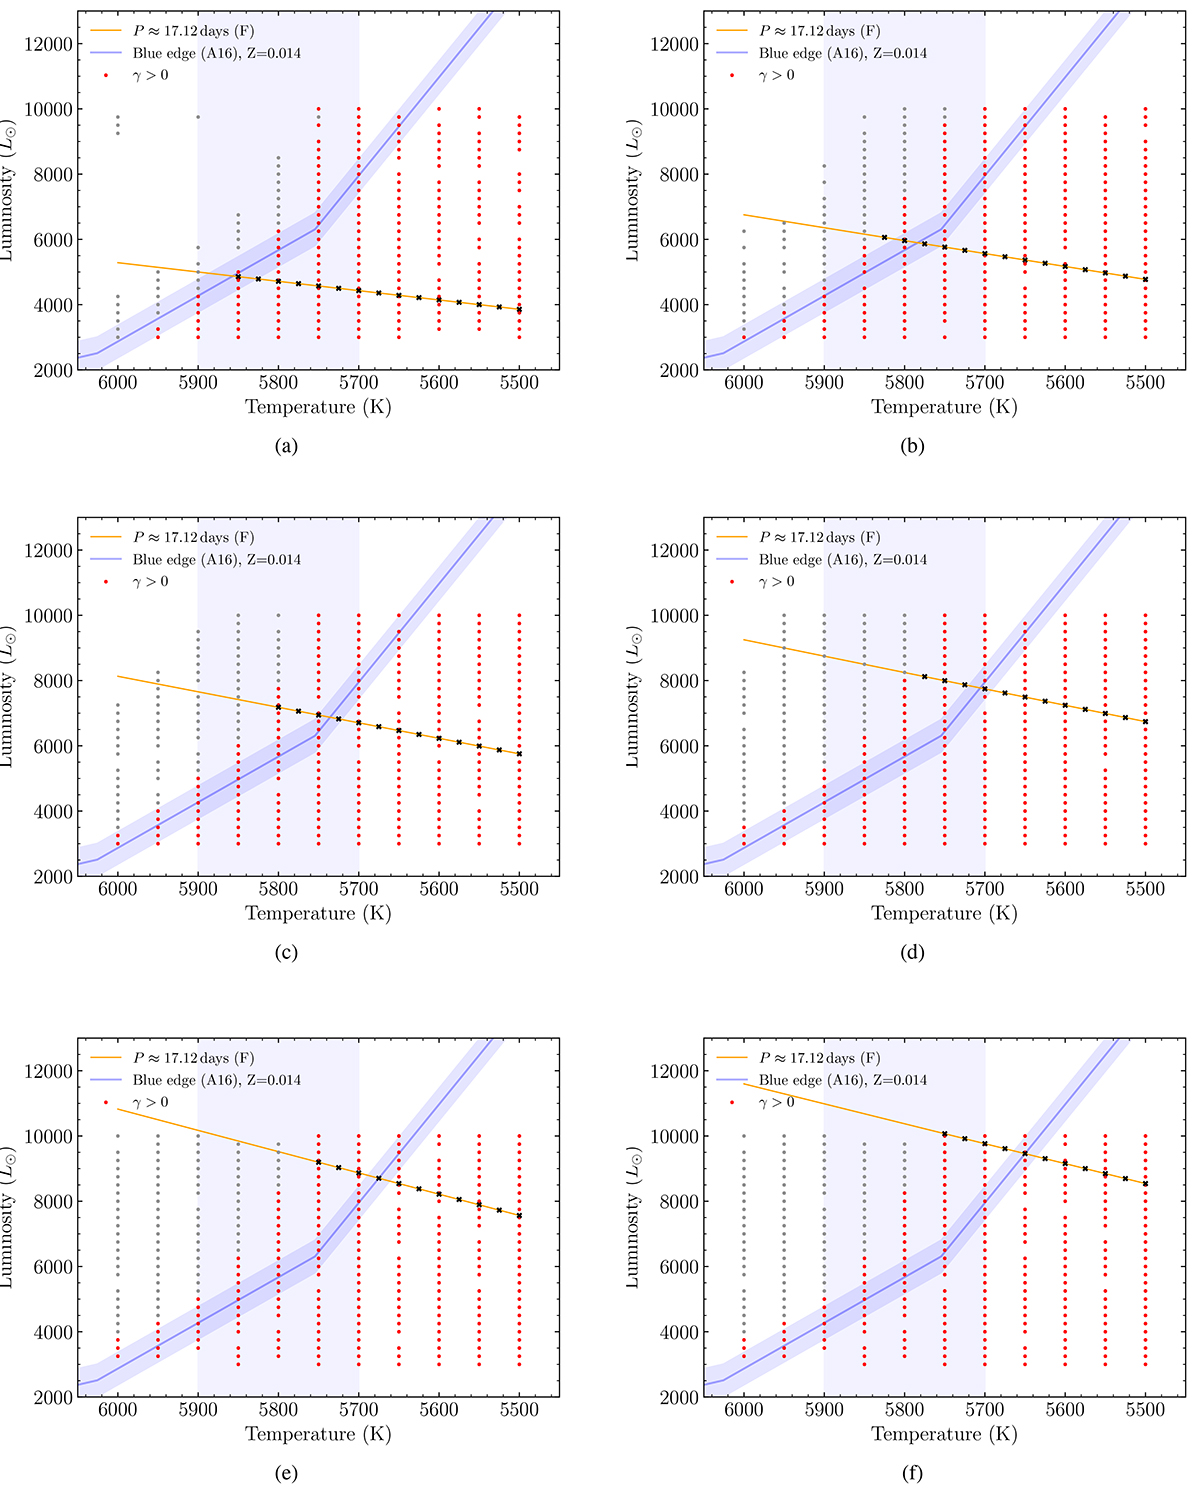
Fig. 1.
Download original image
Results of the linear non-adiabatic (LNA) analysis with MESA-RSP. Positive and negative growth rates, γ for the fundamental mode are indicated in red and grey points, respectively. The black crosses are the selected models for non-linear analysis as summarized in Table 2. The vertical blue strip corresponds to the expected value of the mean effective temperature for Y Oph, i.e., Teff = 5800 ± 100 K (Luck 2018; Proxauf et al. 2018; da Silva et al. 2022). The fundamental blue edge from Anderson et al. (2016) is shown for comparison (see their Fig. 2: Z = 0.14, ωini = 0.5, mix between 2nd and 3rd crossing) with ΔL ± 500 L⊙.
Current usage metrics show cumulative count of Article Views (full-text article views including HTML views, PDF and ePub downloads, according to the available data) and Abstracts Views on Vision4Press platform.
Data correspond to usage on the plateform after 2015. The current usage metrics is available 48-96 hours after online publication and is updated daily on week days.
Initial download of the metrics may take a while.