Open Access
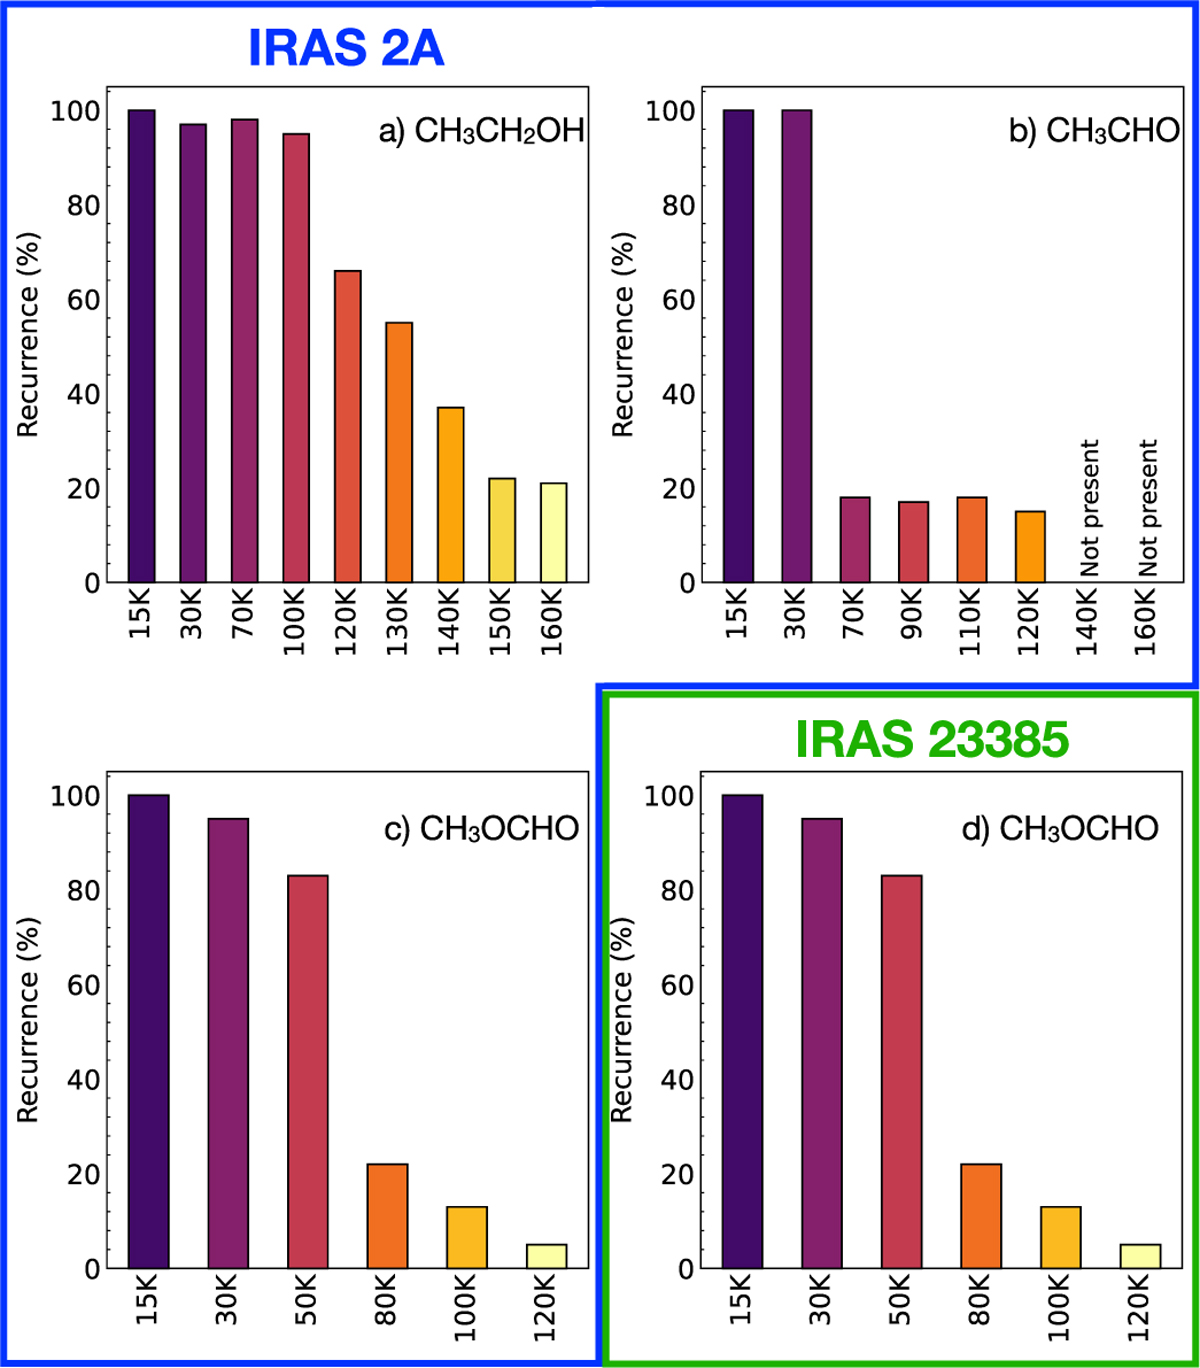
Fig. 9
Download original image
Bar plot showing the recurrence of the same ice mixture, but at different temperatures. Plots inside the blue and green polygons refer to IRAS 2A and IRAS 23385, respectively.
Current usage metrics show cumulative count of Article Views (full-text article views including HTML views, PDF and ePub downloads, according to the available data) and Abstracts Views on Vision4Press platform.
Data correspond to usage on the plateform after 2015. The current usage metrics is available 48-96 hours after online publication and is updated daily on week days.
Initial download of the metrics may take a while.